Facebook
 X
X
 Pinterest
 Copy Link
Good Intentions. Real Consequences. A Lesson Massachusetts Has Already Lived.
Whenever housing costs rise, rent control is often presented as a quick fix. The idea sounds reasonable: limit rent increases to protect tenants from sudden spikes. But housing policy is rarely simple—and Massachusetts has already tested rent control, studied it extensively, and reversed course.
As someone who works daily with homeowners, renters, and investors across Greater Boston and MetroWest, I believe it’s important to look beyond slogans and study what actually happens when rent control is implemented—for renters, homeowners, and the overall housing supply.
What Is Rent Control?
Rent control (or rent stabilization) refers to laws that limit how much landlords can charge for rent or how quickly rents can increase. These policies typically apply to existing rental units and may restrict vacancy decontrol, property improvements, or unit conversions.
The goal is to protect tenants from displacement and improve affordability.
The challenge is that housing markets respond to incentives, and decades of research show rent control changes those incentives in predictable—but often harmful—ways.
Massachusetts Has Been Here Before
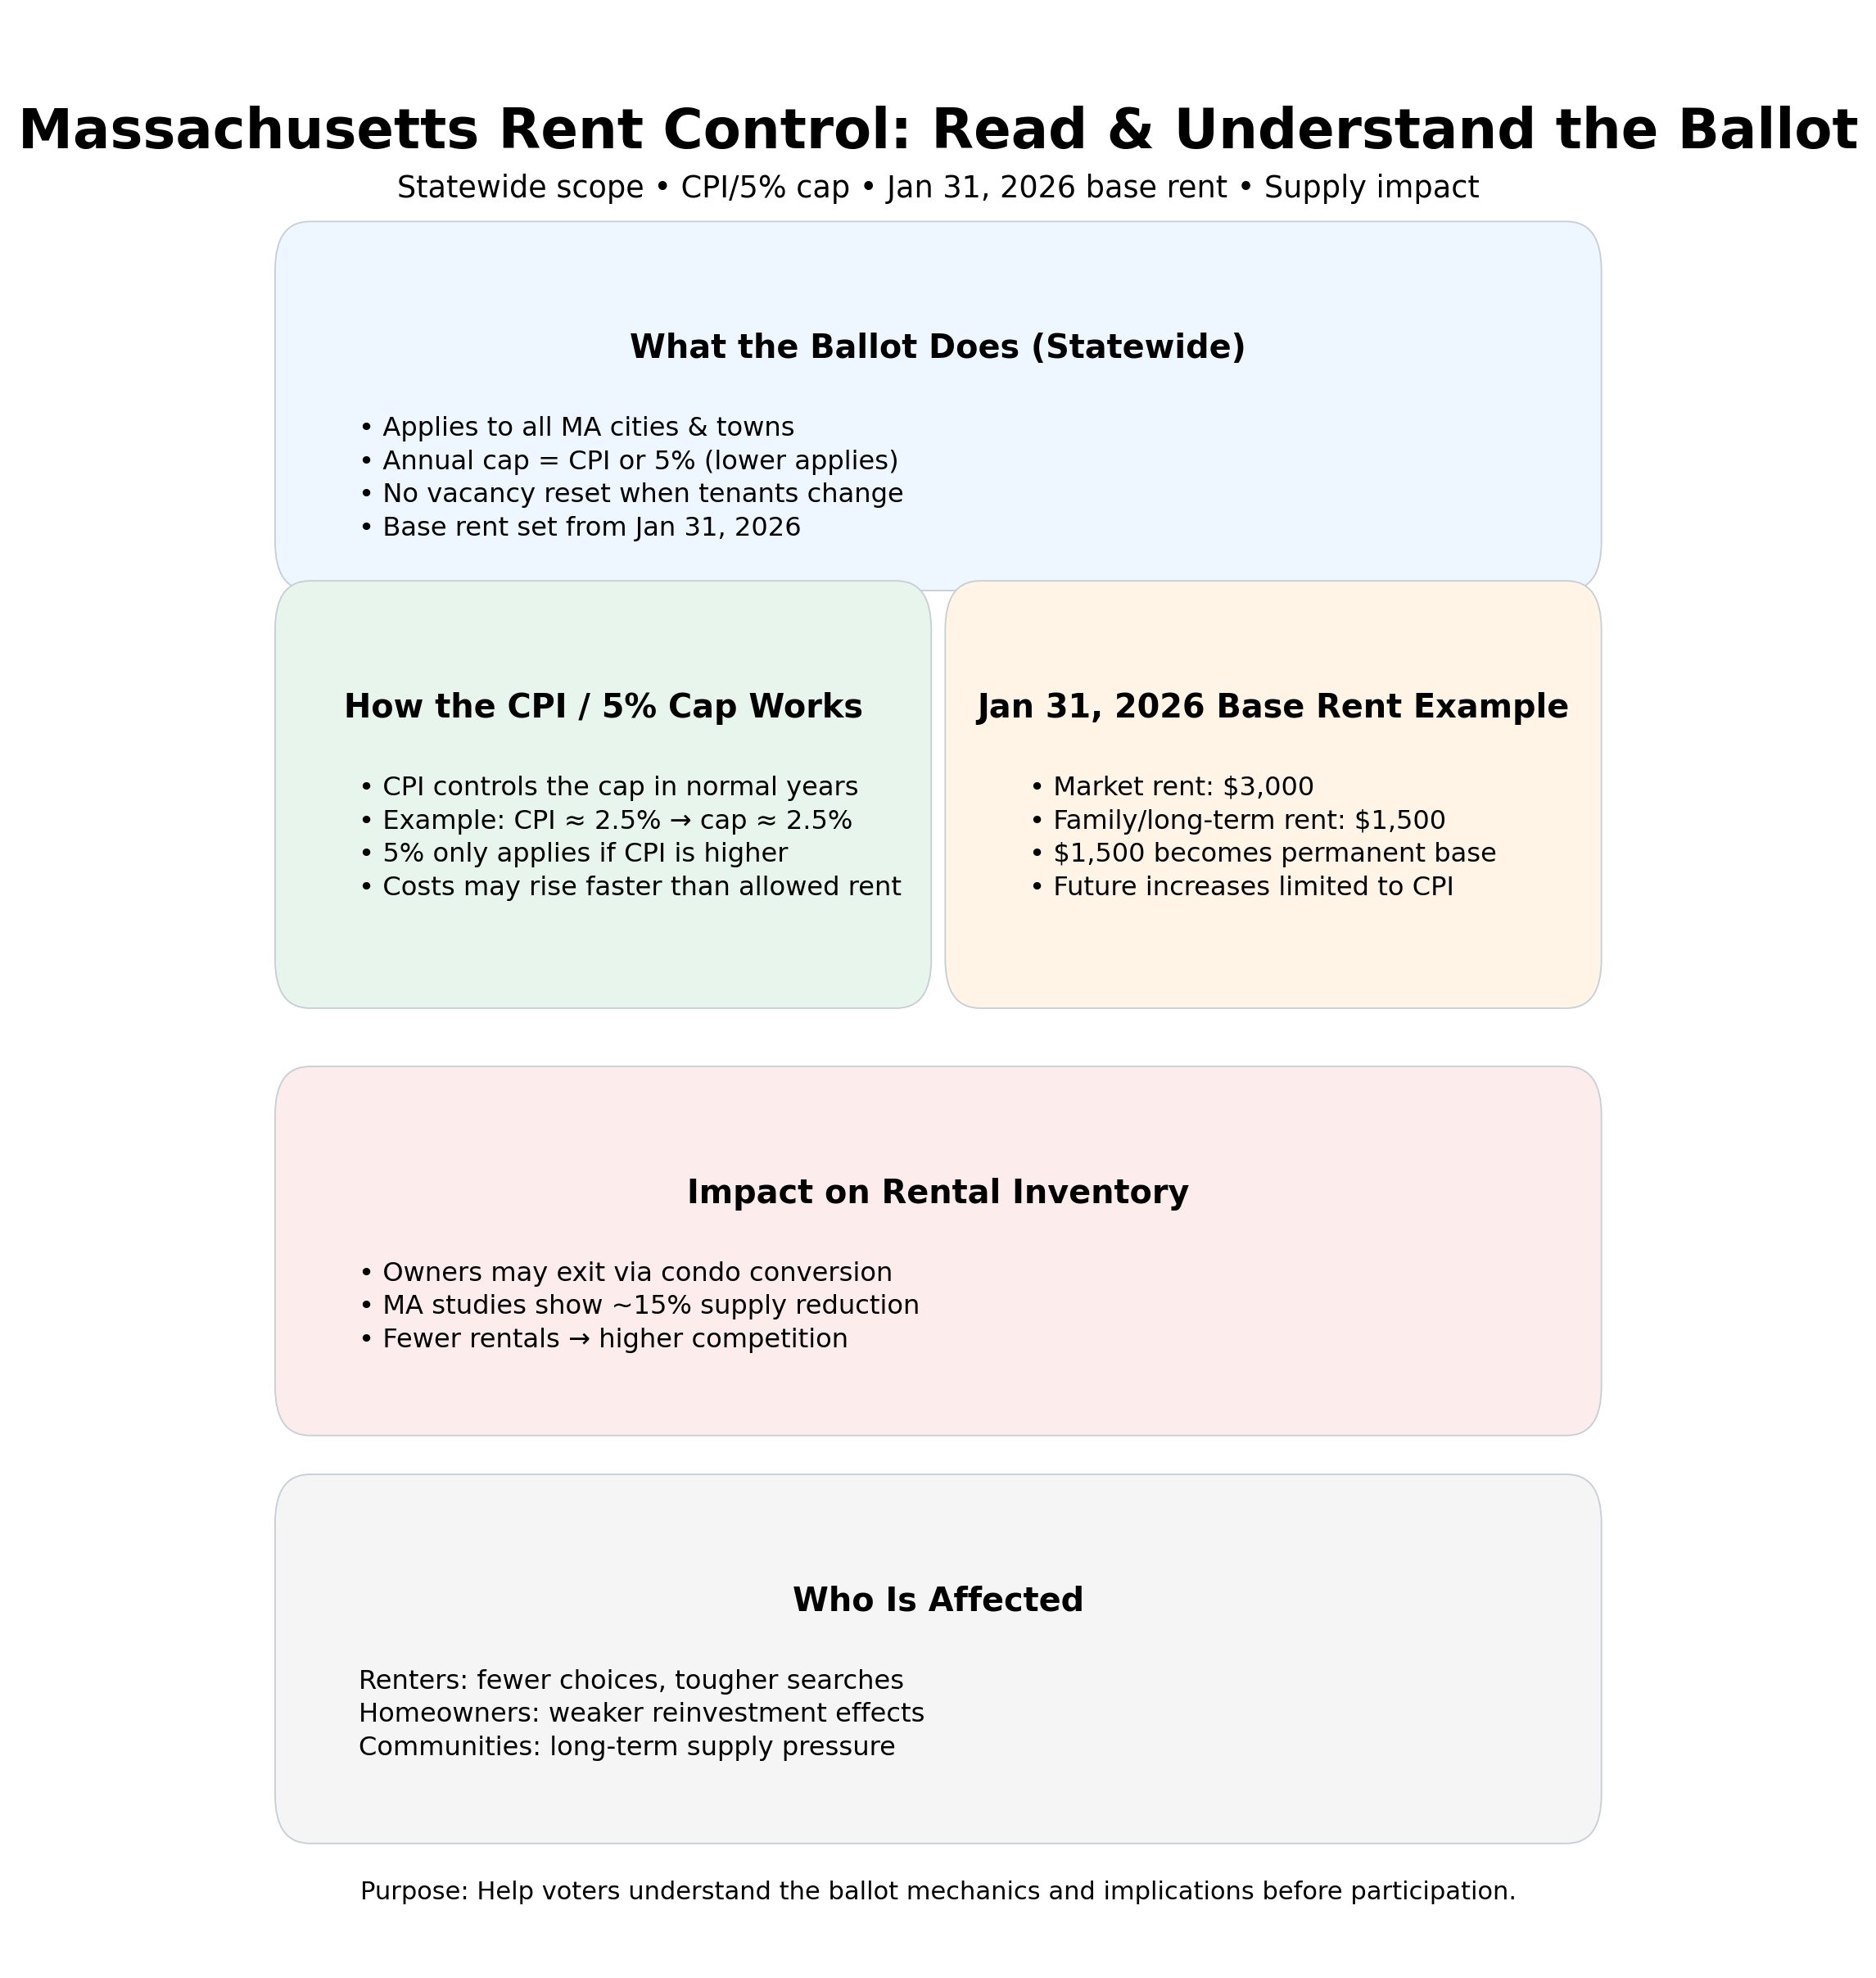
From 1970 to 1994, cities like Cambridge, Brookline, and Boston had some of the strictest rent control laws in the country. In 1994, a statewide ballot initiative repealed these laws, effectively banning rent control across Massachusetts.
Since then, economists, urban planners, and housing researchers have closely examined what happened during rent control and after its repeal—especially in Cambridge, which had the most aggressive controls.
The findings are remarkably consistent.
What the Data Shows
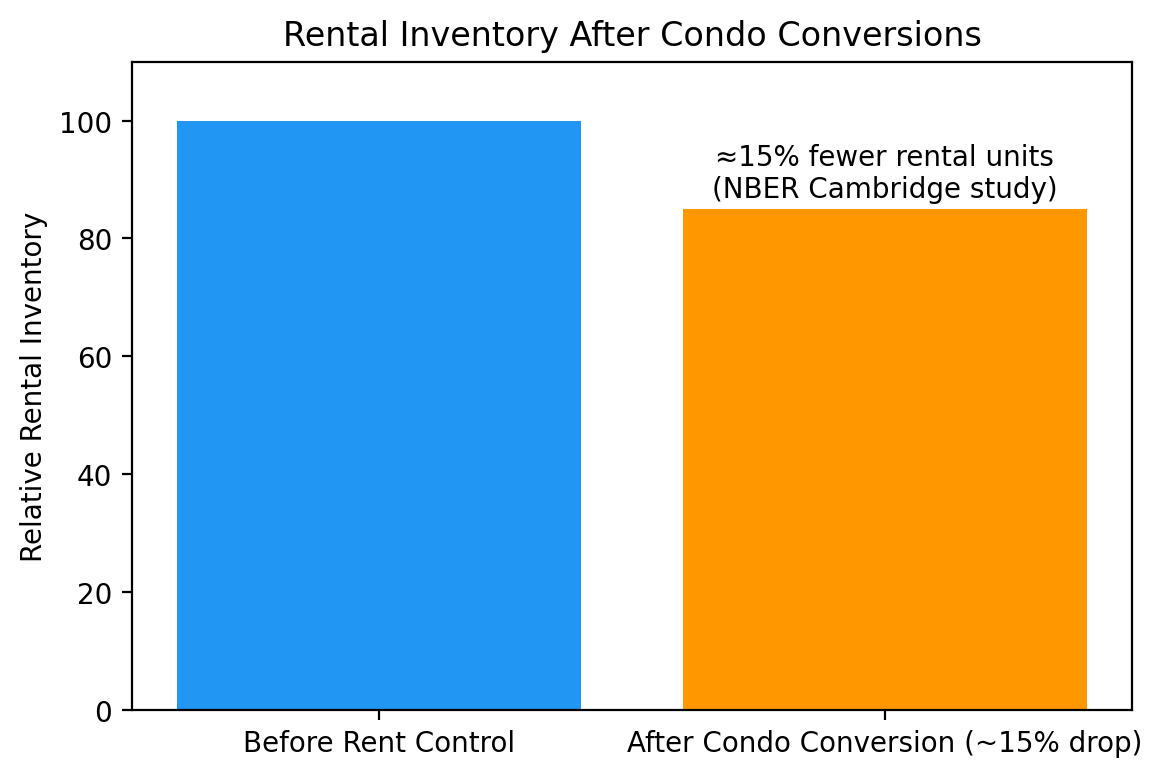
1️⃣ Rent Control Shrinks Housing Supply
Multiple studies find that rent control reduces the number of rental units over time, as landlords convert rentals into condos, sell to owner‑occupants, or withdraw units from the rental market entirely.
In Cambridge alone, researchers found a significant decline in rental inventory while rent control was in place—and a sharp investment rebound after repeal.
2️⃣ Housing Quality Declines
When rent growth is capped, landlords often cannot justify reinvesting in maintenance or upgrades. Over time, this leads to aging, under‑maintained housing stock—hurting the very tenants the policy aims to protect. After rent control ended in Cambridge, housing investment increased by roughly 20%, and renovation activity surged across neighborhoods.
3️⃣ Rent Control Helps Some Renters—But Hurts Many Others
Research consistently shows rent control benefits current tenants who already occupy controlled units, often at significant discounts. However, it also:
- Raises rents in uncontrolled units
- Makes housing harder to find for new renters
- Reduces mobility, trapping people in units that no longer fit their needs.
In effect, access becomes based on timing—not need.
4️⃣ Homeowners and Neighborhoods Are Affected Too
Rent control doesn’t just affect landlords and tenants. Studies of Cambridge found that rent control lowered surrounding property values and reduced neighborhood investment, affecting homeowners who never owned rental property.
After repeal, Cambridge experienced an estimated $7.8 billion increase in residential property values, much of it from spillover improvements in nearby homes.
Why This Matters Right Now
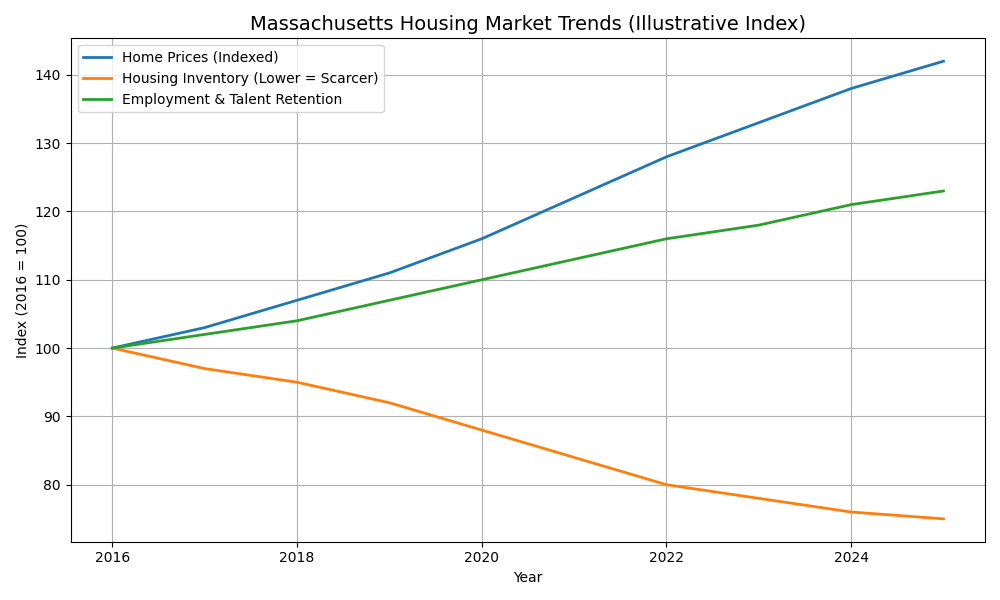
From my perspective working in Massachusetts real estate, today’s housing challenge isn’t just affordability—it’s supply.
Policies that discourage new construction, renovation, or long‑term rental ownership reduce overall inventory, which eventually pushes rents higher for everyone, especially renters who don’t already have housing.
Rent control may feel like an immediate response, but history suggests it often trades short‑term relief for long‑term scarcity.
A More Effective Question to Ask
Instead of asking “How do we cap rents?”, data suggests we should be asking:
- How do we increase housing supply?
- How do we incentivize development and renovation?
- How do we protect vulnerable renters without shrinking inventory?
Massachusetts’ own experience offers a rare, real‑world case study—and it’s one worth examining carefully.
A Thoughtful Call to Action
Whether you’re a renter, homeowner, or investor, housing policy affects you—directly or indirectly.
Before supporting any proposal:
- Review the data
- Understand Massachusetts’ history
- Consider both intended and unintended consequences
Engage in the conversation informed by evidence, not just urgency. Housing is too important—and too complex—for shortcuts.