
 Facebook
 X
X
 Pinterest
 Copy Link
What does Housing Affordability Mean?
It refers to the relationship between household income and housing costs—essentially, whether people can reasonably afford to buy or rent a home without compromising their ability to pay for other essentials like food, healthcare, and transportation. Factors Affecting Affordability: Local wages and employment opportunities, Home prices and rental rates, Availability of housing stock (especially affordable units), Interest rates (for buyers), and Government policies and subsidies.
There is an Housing Affordability Index (HAI) that is put out by the National Association of Realtors (NAR) in the U.S. The Housing Affordability Index (HAI) is a measure used to determine whether a typical family earns enough income to qualify for a mortgage on a typical home. It’s a key tool in understanding how affordable housing is in a given area or time period. Based on a 30-year fixed mortgage with a 20% down payment and uses Freddie Mac’s mortgage rate data, assumes a 25% qualifying ratio, meaning housing expenses should not exceed 25% of gross monthly income.Their formula is:
Housing Affordability Index = (Median Family Income / Required Income to Qualify for a Mortgage) × 100
Median Family Income: The average income of a typical household.
Required Income: The income needed to qualify for a mortgage on a median-priced home, assuming:
20% down payment
30-year fixed mortgage
Standard qualifying ratio (usually 25% of income goes to housing costs)
📊 Interpreting the Index
- HAI = 100: A family earning the median income has exactly enough to qualify for a mortgage.
- HAI > 100: Housing is more affordable—the family earns more than needed.
- HAI < 100: Housing is less affordable—the family earns less than needed.
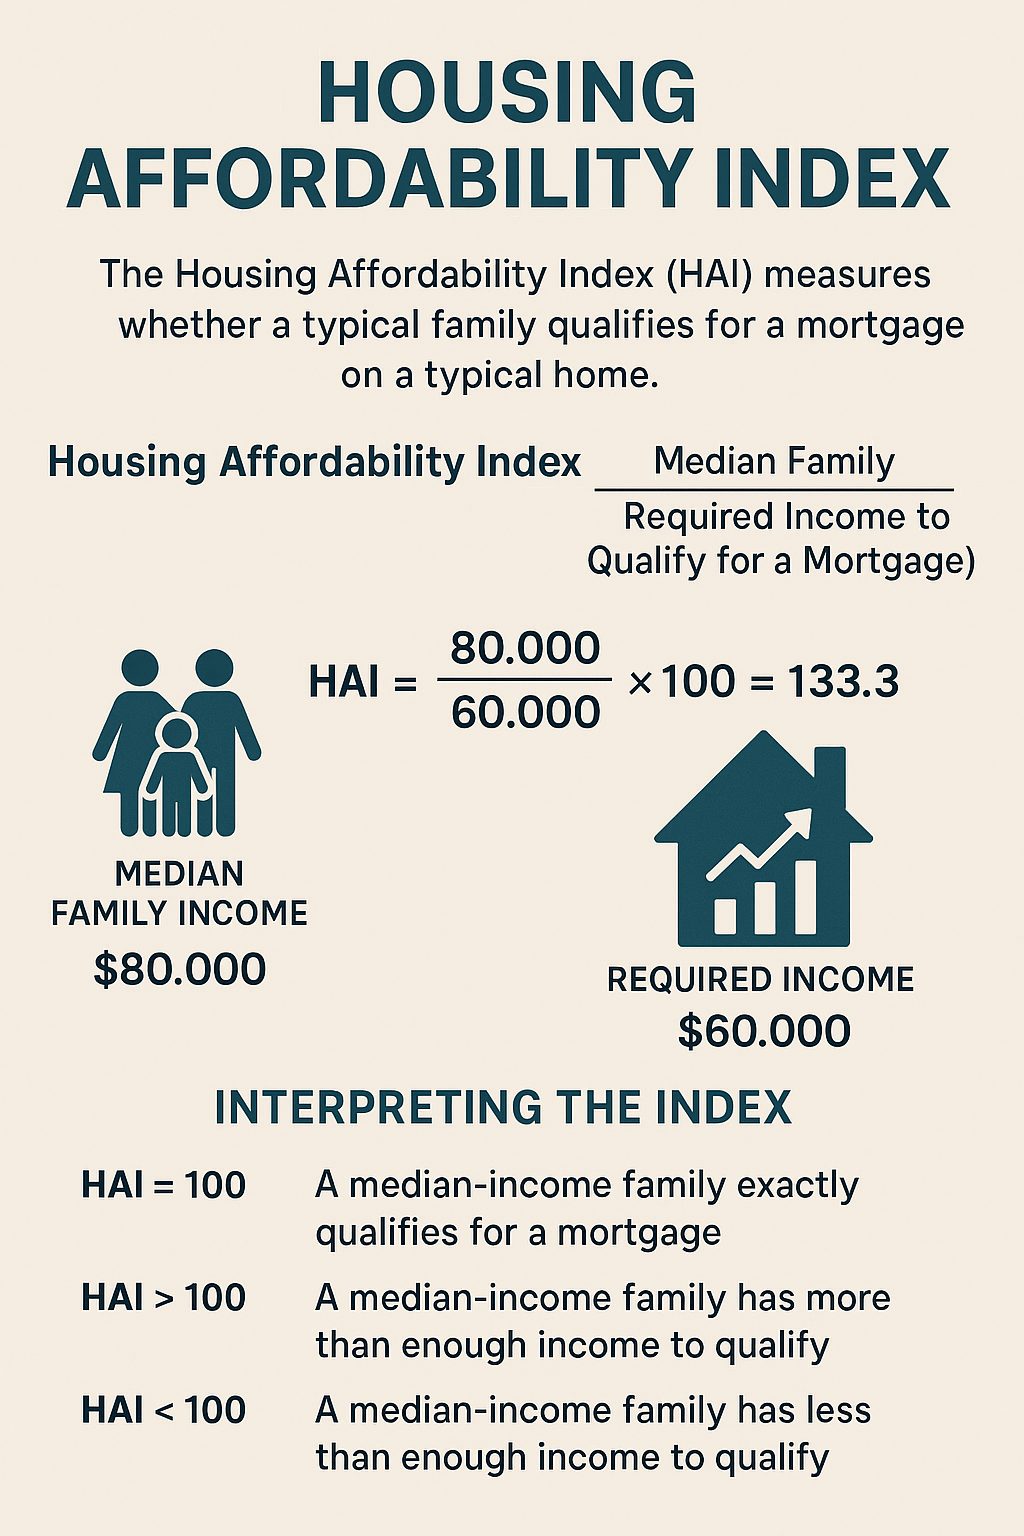
🏠 Example
If the median income is $80,000 and the income needed to afford a median-priced home is $60,000:
This means the typical family earns 33% more than needed to afford a home.
Why Does It Matter?
Lack of affordable housing can lead to overcrowding, homelessness, and economic instability. It affects where people can live, work, and raise families—impacting everything from education access to job opportunities. NAR puts out a Metro Market Statistics Dashboard showing the stats for each of these factors. There are currently many challenges and the implications of the current housing affordability crisis for buyers in 2025 are significant and multifaceted.
Here’s a breakdown of the key challenges and trends:
🏠 1. Rising Home Prices and Mortgage Costs
- Home prices have surged nearly 60% since 2019, with the median existing single-family home now costing $412,000, which is five times the median household income
1. https://www.realtor.com/news/trends/affordability-crisis-home-prices-record-household-income-housing-report-2025/
- Monthly mortgage payments have increased dramatically, now averaging $2,570, which is 40% higher than in 1990 (adjusted for inflation)
1. https://www.realtor.com/news/trends/affordability-crisis-home-prices-record-household-income-housing-report-2025/
- Buyers now need to spend 45% more of their income on mortgage payments compared to 2019
2. https://www.jpmorganchase.com/institute/all-topics/community-development/the-affordability-gap-is-home-ownership-still-within-reach-in-todays-economy
📉 2. Declining Affordability Index
- The U.S. Housing Affordability Index dropped from 150 in 2021 to the mid-80s by 2024, indicating a sharp decline in affordability
3. https://resimpli.com/blog/housing-affordability-statistics/
- Only 60% of U.S. counties are affordable for households earning the local median income, down from 90% five years ago
3. https://resimpli.com/blog/housing-affordability-statistics/
🧓 3. Changing Buyer Demographics
- The average age of first-time homebuyers rose to 38 years old, as younger buyers struggle to afford homes
2. https://www.jpmorganchase.com/institute/all-topics/community-development/the-affordability-gap-is-home-ownership-still-within-reach-in-todays-economy
- Millennials make up 70% of first-time buyers, but many are priced out due to stagnant wages and rising costs
3. https://resimpli.com/blog/housing-affordability-statistics/
🏘️ 4. Shifts in Buyer Preferences
- Suburban housing is preferred by 56% of buyers, likely due to lower prices compared to urban centers
3. https://resimpli.com/blog/housing-affordability-statistics/
- Modular and small homes are gaining popularity, with 67% of respondents believing they will become mainstream
3. https://resimpli.com/blog/housing-affordability-statistics/
💸 5. Financial Strain and Cost Burden
- 31.8% of households are cost-burdened, spending more than 30% of their income on housing
3. https://resimpli.com/blog/housing-affordability-statistics/
- In cities like Boston, property taxes and insurance add up to $1,000/month on top of mortgage payments
1. https://www.realtor.com/news/trends/affordability-crisis-home-prices-record-household-income-housing-report-2025/
🔒 6. Lock-In Effect and Inventory Shortage
- Many homeowners are reluctant to sell due to low existing mortgage rates, reducing inventory and pushing prices higher
1. https://www.realtor.com/news/trends/affordability-crisis-home-prices-record-household-income-housing-report-2025/
- Housing inventory has decreased by 30% since 2019, further limiting options for buyers
3. https://resimpli.com/blog/housing-affordability-statistics/
🧠 Implications for Buyers
- Affordability planning is critical: Buyers must reassess budgets and consider longer mortgage terms or alternative housing types.
- Expect lifestyle compromises: Many are opting for smaller homes, suburban locations, or extensive renovations to make purchases feasible.
- Financial literacy and preparation: With rising down payments and closing costs, buyers need stronger financial strategies and savings.
A local Example of the House Affodability
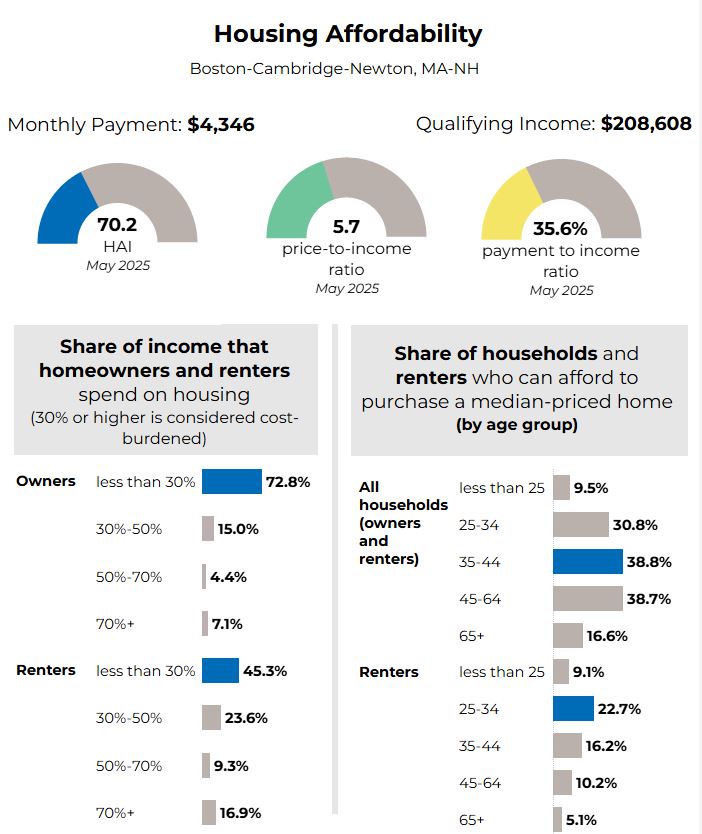
A report put out by NAR shows the most recent housing, demographic, economic and affordability statistics for Boston-Cambridge-Newton, MA-NH area.
- https://www.nar.realtor/research-and-statistics/housing-statistics/metro-market-statistics
Here are some staggering statistics for the share of income that homeowners and renters spend on housing. 30% or higher is considered cost-burdened.
🏠 Key Affordability Metrics
- Monthly Mortgage Payment: $4,346
- Qualifying Income: $208,608
- Housing Affordability Index (HAI): 70.2
- A lower HAI indicates reduced affordability. A value of 100 means a median-income household can afford a median-priced home. At 70.2, affordability is significantly below the national benchmark.
- Price-to-Income Ratio: 5.7
- This is quite high. A healthy ratio is typically around 3–4.
- Payment-to-Income Ratio: 35.6%
- This exceeds the recommended threshold of 30%, suggesting that housing costs are burdensome for many buyers.
📊 Housing Cost Burden by Tenure
Homeowners
- 72.8% spend less than 30% of income on housing (considered affordable).
- 27.2% are cost-burdened:
- 15.0% spend 30–50%
- 4.4% spend 50–70%
- 7.1% spend more than 70%
Renters
- Only 45.3% spend less than 30% of income on rent.
- A significant 54.7% are cost-burdened:
- 23.6% spend 30–50%
- 14.6% spend 50–70%
- 16.9% spend more than 70%
🔍 Renters are more severely impacted by affordability challenges than homeowners.
👥 Affordability by Age Group
All Households (Owners + Renters)
- 35–44 and 45–64 age groups have the highest affordability (≈38.8%)
- Under 25: Only 9.5% can afford a median-priced home
- 65+: Just 16.6% can afford
Renters Only
- Under 25: 9.1% can afford
- 25–34: 22.7%
- 35–44: 16.2%
- 45–64: 10.2%
- 65+: 1.5%
🔍 Older renters (especially 65+) face the greatest affordability challenges, likely due to fixed incomes and lack of home equity.
🧭 Overall Takeaways
- Affordability is a key and most urgent challenge in today’s housing market.
- Given the high house prices and tight inventory, many nuyers are holding on in this market and their dreams of owning a home the traditional way is just that, a dream still.
- Boston MA-NH is one of the least affordable metro areas in the U.S.
- High housing costs are disproportionately affecting renters, young adults, and seniors.
- The HAI of 70.2 and payment-to-income ratio of 35.6% highlight systemic affordability issues.
- Policy implications could include expanding affordable housing, rent control measures, and targeted assistance for vulnerable age groups.


