
 Facebook
 X
X
 Pinterest
 Copy Link
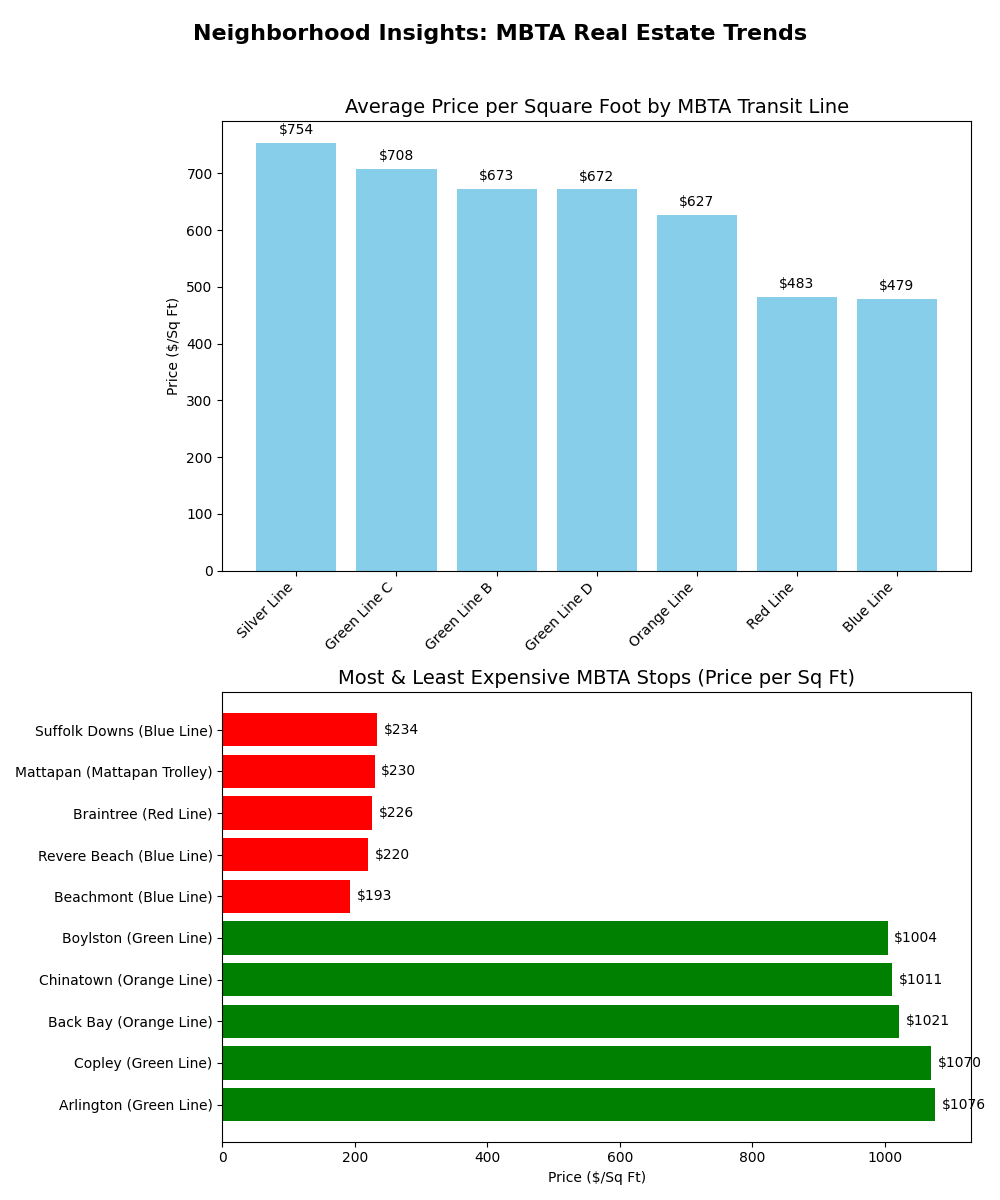
I asked AI, “What is the breakdown of price per square foot by MBTA transit line?”
Here’s what AI had to say about a breakdown of the average price per square foot by MBTA transit line in the Boston area, based on Estately’s analysis of home sales within a half-mile of each stop:
🏙️ MBTA Transit Line Price Per Square Foot
| Transit Line | Average Price/Sq Ft |
|---|---|
| Silver Line | $754 |
| Green Line C Branch | $708 |
| Green Line B Branch | $673 |
| Green Line D Branch | $672 |
| Orange Line | $627 |
| Red Line | $483 |
| Blue Line | $479 |
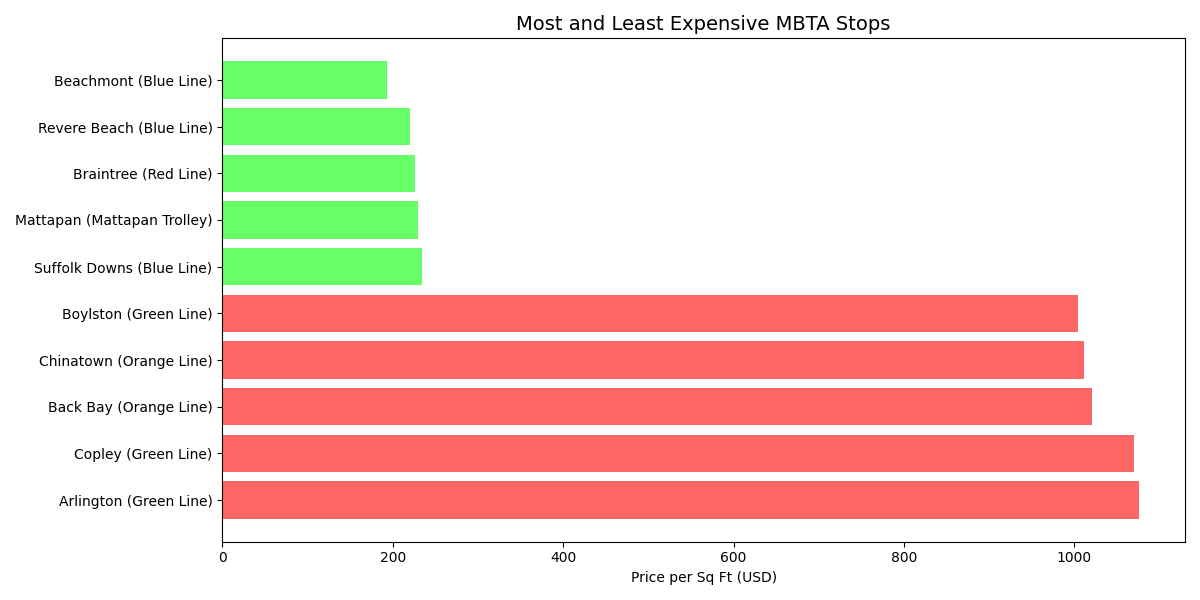
🚉 Most Expensive Stops (Price/Sq Ft)
- Arlington (Green Line) – $1,076
- Copley (Green Line) – $1,070
- Back Bay (Orange Line) – $1,021
- Chinatown (Orange Line) – $1,011
- Boylston (Green Line) – $1,004
🏘️ Least Expensive Stops (Price/Sq Ft)
- Beachmont (Blue Line) – $193
- Revere Beach (Blue Line) – $220
- Braintree (Red Line) – $226
- Mattapan (Mattapan Trolley) – $230
- Suffolk Downs (Blue Line) – $234
Please see the breakdown by stop and and T color line/branch
https://www.estately.com/boston-area-home-affordability-transit-stop
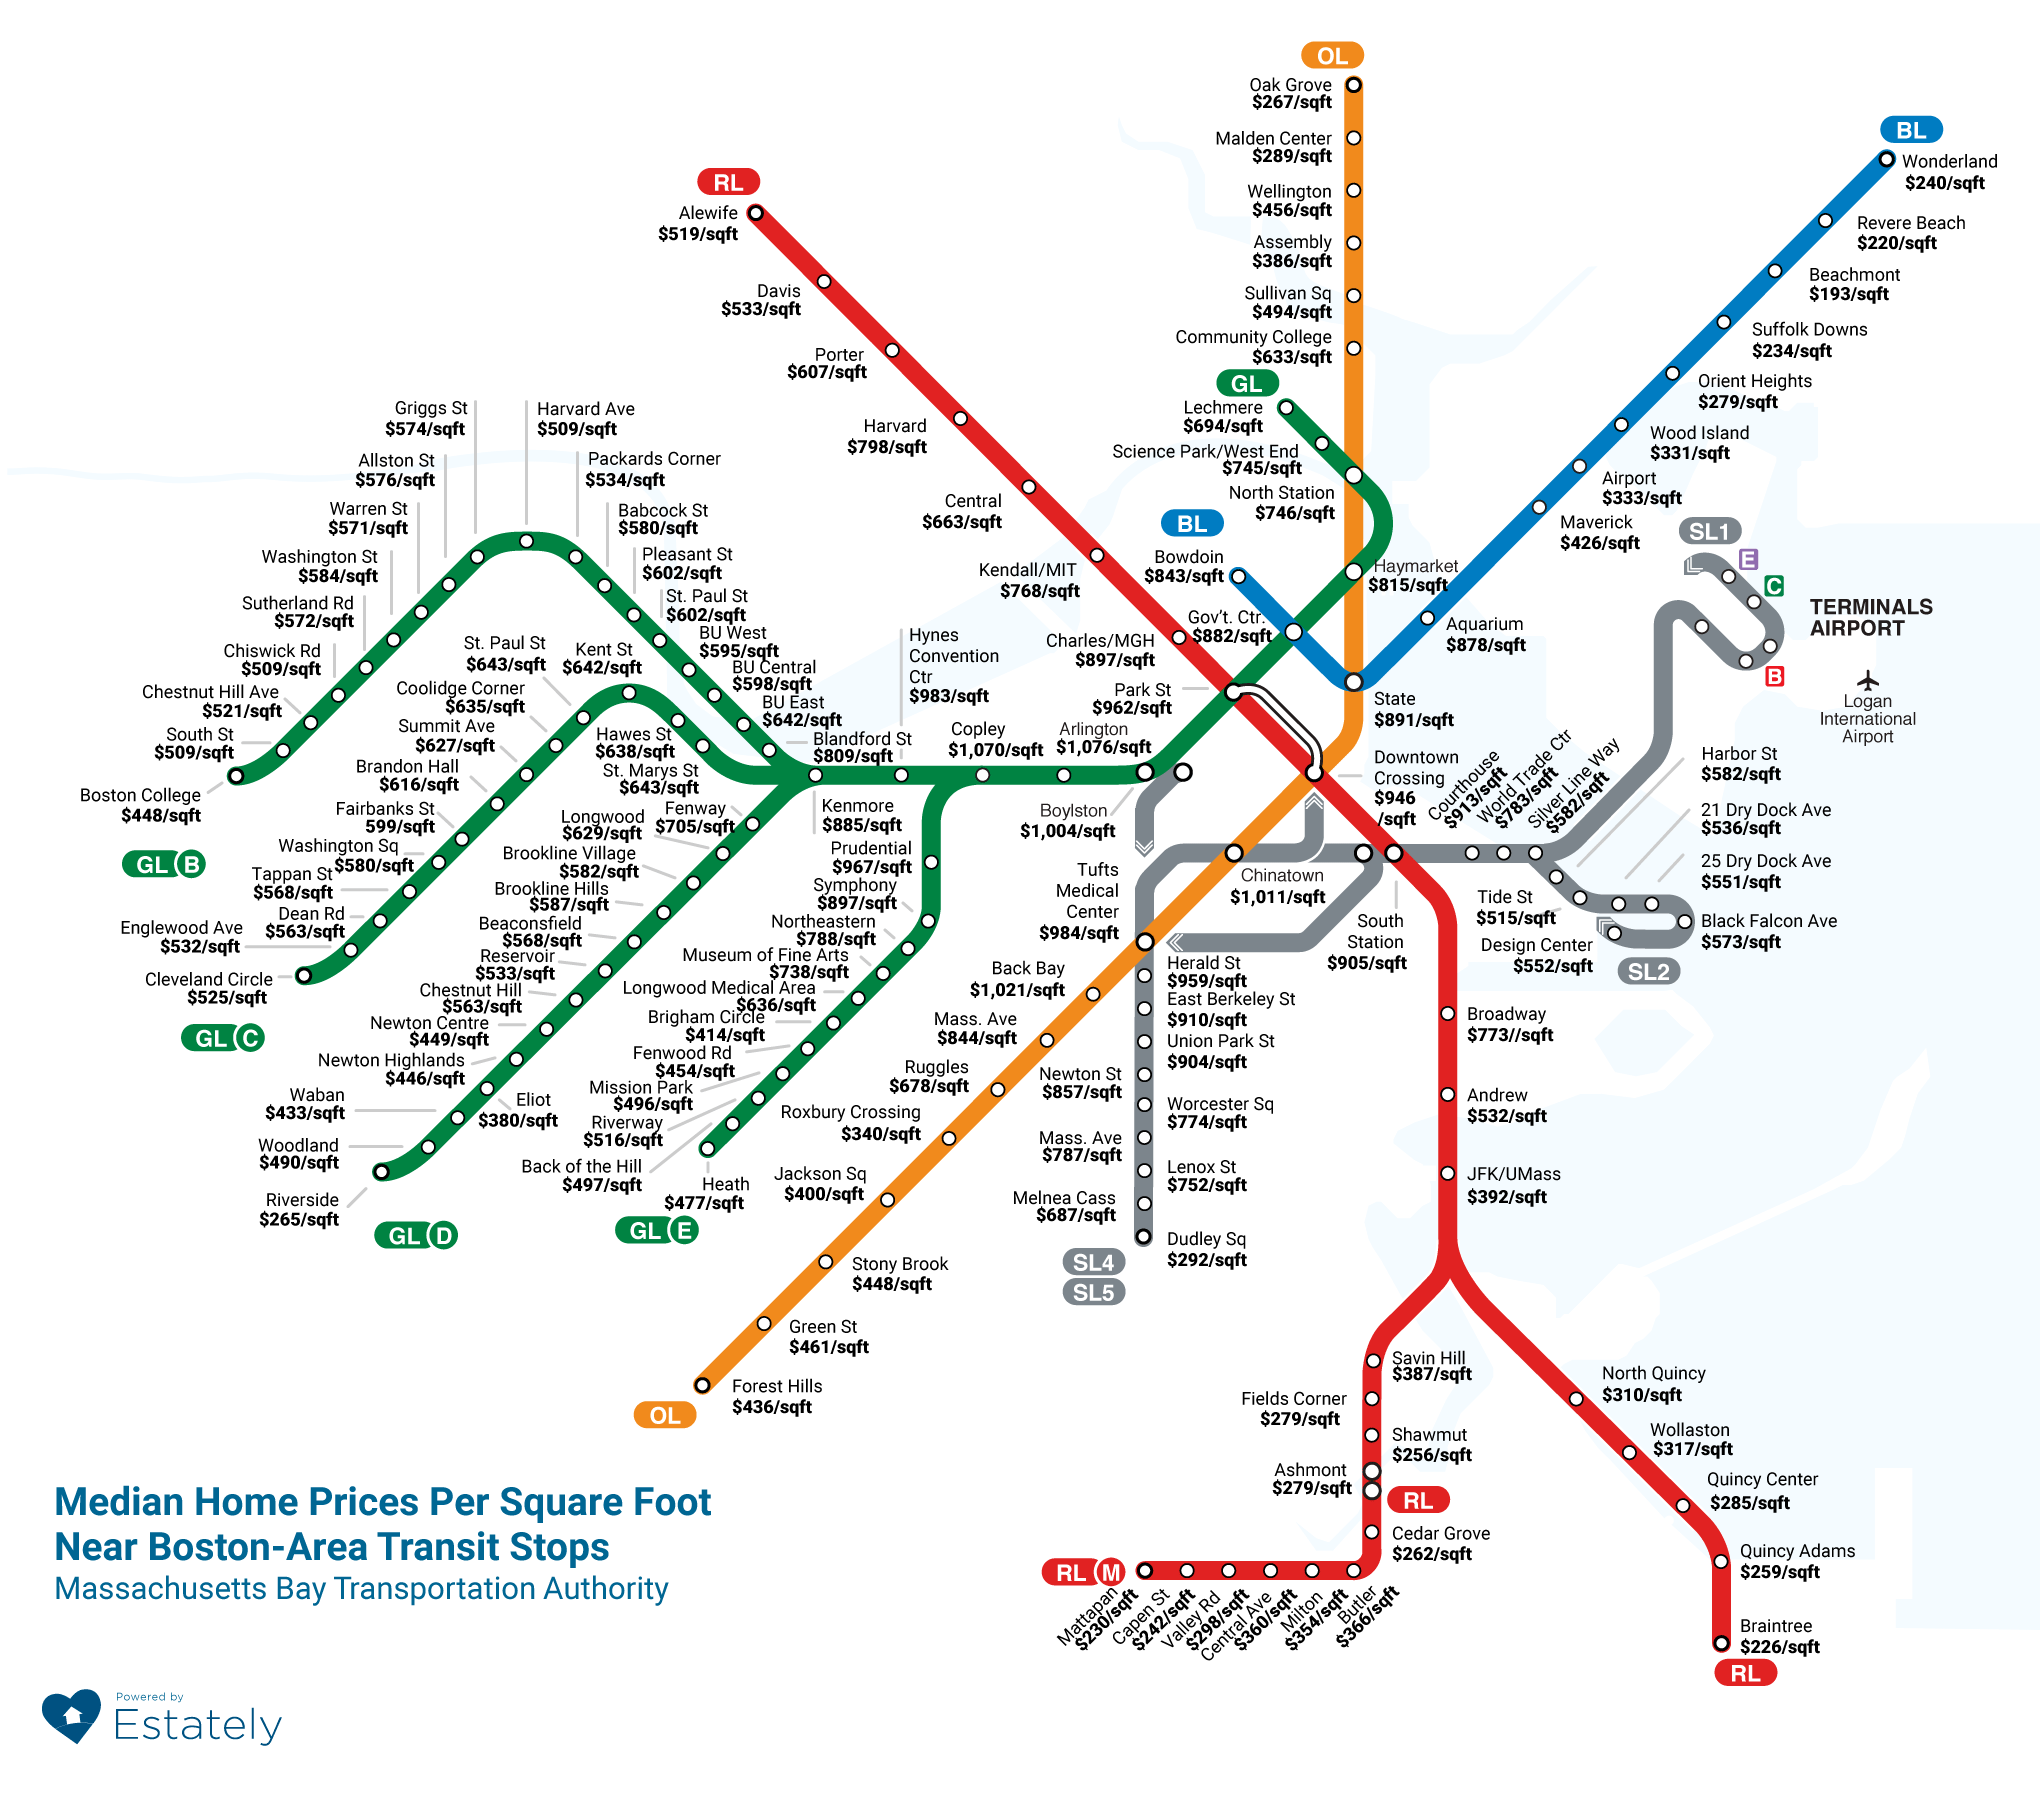
As can be seen per estately.com analysis,
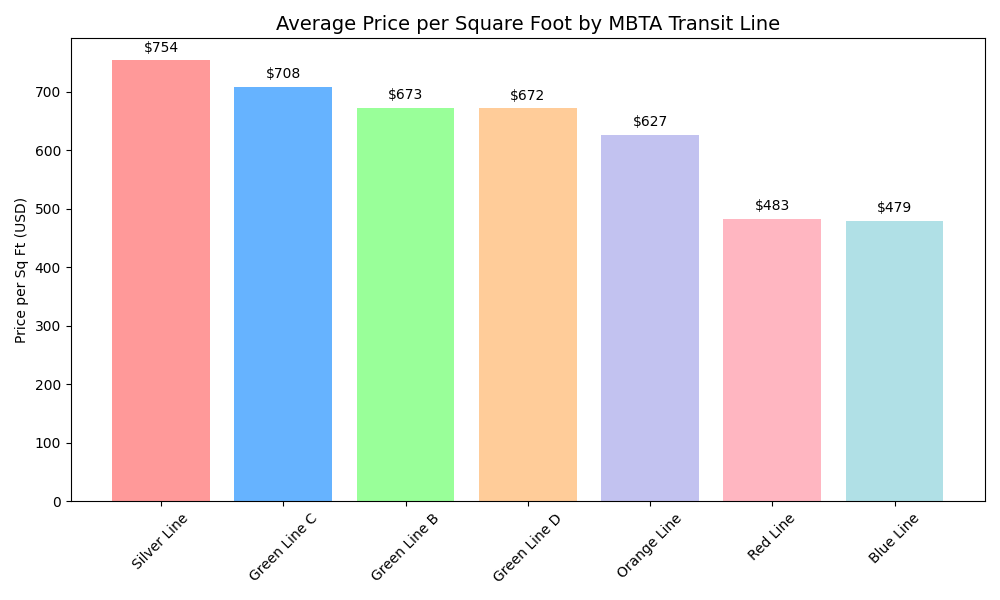
Boston median price per square foot by transit line
Silver Line: Holds the highest average price per square foot at $754.
Green Line: Varies by branch, but generally high:
“C” Branch: $708
“B” Branch: $673
“D” Branch: $672
Orange Line: $627
Red Line: $483
Blue Line: $479
Most expensive/affordable areas near transit
Most expensive: Arlington Stop on the Green Line boasts the highest price per square foot at $1,076. Other expensive areas include Back Bay ($1.5K/sq ft) and Beacon Hill ($1.4K/sq ft) which are served by multiple lines.
Least expensive: Beachmont stop on the Blue Line was identified as the least expensive at $193 per square foot.
Commuter rail zones
The Commuter Rail system is divided into 11 fare zones (Zone 1A to Zone 10), with Zone 1A representing stations closest to downtown Boston. Commuter rail zones generally indicate distance from downtown. Specific median home prices per square foot by commuter rail zone were not identified in the search results but a strong correlation between proximity to the city center (lower zone numbers) and higher property values can be inferred.
Note: The above provided data comes from various sources and may reflect different timeframes. Some data, such as the analysis by Estately, is based on data from the last six months (as of when the analysis was published).


