
 Facebook
 X
X
 Pinterest
 Copy Link
Massachusetts Real Estate Withholding Law – Effective November 1, 2025
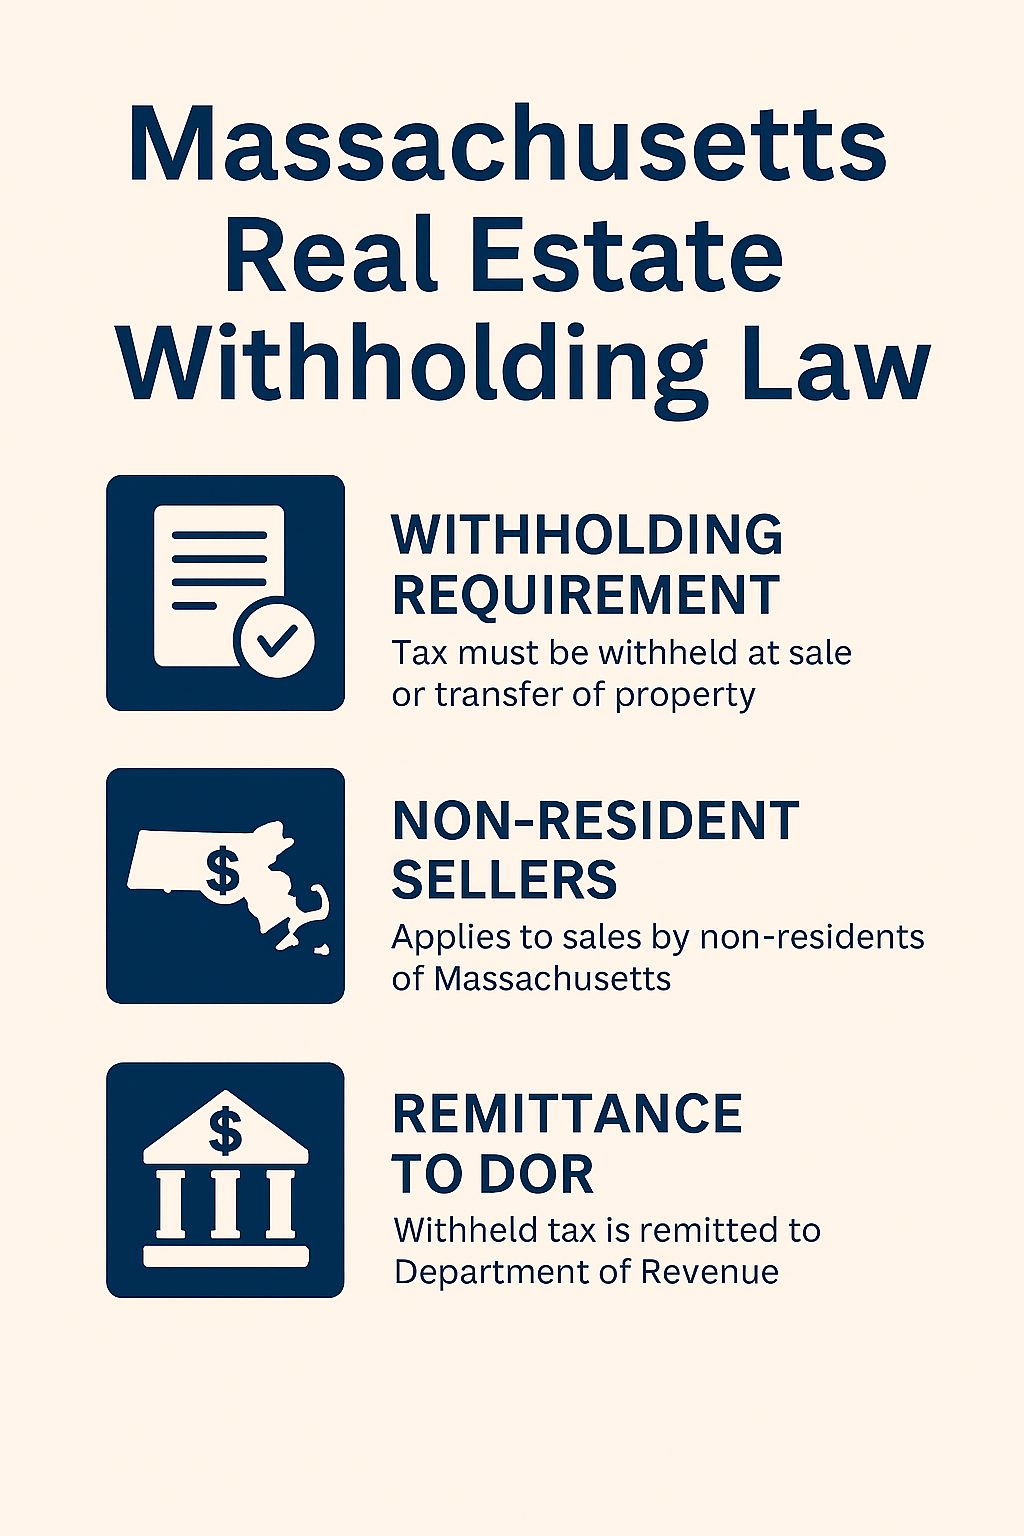
The upcoming new Massachusetts regulation 830 CMR 62B.2.4 issued by the Massachusetts Department of Revenue (DOR), under M.G.L. c. 62B, § 2, establishes withholding requirements on the sale or transfer of Massachusetts real estate. Basically, the law authorizes the DOR to require withholding of taxes on certain payments, including real estate sales. It targets nonresident Sellers (individuals or entities) without a continuing Massachusetts presence, selling Massachusetts real estate where the gross sales price is $1,000,000 or more. [mass.gov]
The expected effective date applies to real estate closings on or after November 1, 2025.
🔹 Key Requirements
- Withholding At Closing Agent Responsibilities:
- Typically Settlement agents – closing attorney, title company, or escrow agent.
- Must withhold a portion of the sale proceeds (typically 4-5% or more of the gross sale proceeds) and remit it to the MA DOR within 10 days of closing.
- Must file a Form NRW (Nonresident Real Estate Withholding Return), even if no tax is withheld. [stewart.com]
- Electronic Filing: All filings and payments must be submitted via https://www.mass.gov/orgs/massachusetts-department-of-revenue.
- Transferor (Seller) Responsibilities:
- Sellers must complete a Transferor’s Certification form to document residency or exemption status.
- This form documents the seller’s capital gain and exemption status, if applicable. [mass.gov]
- Sellers must complete a Transferor’s Certification form to document residency or exemption status.
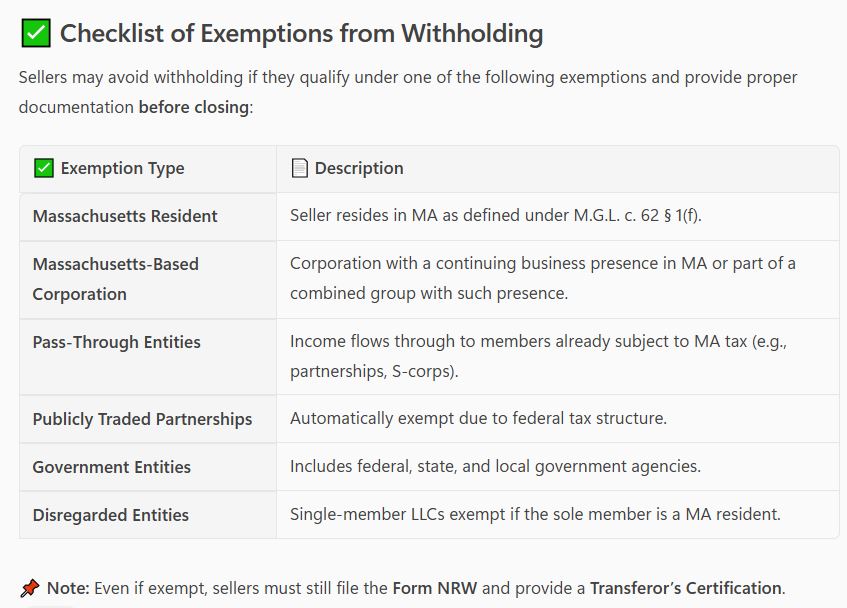
🔹 Exemptions & Exceptions
- Certain sellers may qualify for exemptions from withholding, if they are
- Massachusetts residents (Defined under M.G.L. c. 62 § 1(f) and they must certify residency status on the Transferor’s Certification.)
- Certain types of MA based entities (Corporations with a continuing business presence in the Commonwealth. And, members of a combined group where at least one member has a Massachusetts presence.)
- Pass-Through Entities (Entities whose income flows through to members already subject to MA tax. And includes partnerships and S-corps filing Massachusetts tax returns.)
- Publicly traded partnerships (Automatically exempt due to their tax structure and reporting obligations.)
- Government entities (Includes the Federal government, Massachusetts government, and political subdivisions or agencies.)
- Disregarded entities (e.g., single-member LLCs) whose sole member is a Massachusetts resident. [mass.gov], [virtualund…writer.com], [riw.com] And if the exemption is based on the owner’s tax status, not the entity itself.
⚠️IMPORTANT NOTE:
- Even if exempt, the Form NRW (Nonresident Real Estate Withholding) must still be filed by the withholding agent. [stewart.com].
- Sellers should consult a tax advisor well before closing to ensure compliance.
- Failure to comply may result in penalties and interest.
🔹 Withholding Rates
- Standard Rate: 4% of the gross sales price
- Alternative Rate: 5% of the estimated net gain
- Surtax: Additional 4% may apply if the gain exceeds the surtax threshold. [dlgclosing.com]
🔹 Special Cases Covered
- Installment sales
- Like-kind exchanges
- Corporate entities
- Estimated adjusted basis calculations
🔹 Special Cases Covered explained:
- Installment Sales
- If a real estate sale qualifies as an installment sale under Massachusetts law (M.G.L. c. 62, § 63), the entire gross sales price is still considered for withholding purposes.
- However, the withholding amount may be limited to the cash received at closing, not the full contract price.
- The Transferor’s Certification must disclose the installment nature of the transaction and the amount of cash received.
- Like-Kind Exchanges (IRC § 1031)
- If the transaction qualifies as a like-kind exchange under IRC § 1031, and the gain is deferred, withholding is not required on the deferred portion.
- The Transferor must certify:
- The amount of gain deferred.
- That they consent to Massachusetts jurisdiction for future tax collection when the gain is eventually recognized.
- If any gain is recognized (e.g., due to boot or partial cash received), withholding is required on that recognized portion.
- Corporate Entities
- Corporations with a continuing Massachusetts business presence may be exempt from withholding.
- To qualify:
- The corporation must have filed a Massachusetts tax return in the prior year.
- It must maintain a place of business in Massachusetts.
- It must not be selling all or substantially all of its Massachusetts assets (which would trigger other tax obligations under M.G.L. c. 62C, § 51).
- Estimated Adjusted Basis Calculations
- This is used when a seller elects the alternative withholding method based on estimated net gain rather than gross sales price.
- Estimated Adjusted Basis includes:
- The original purchase price (or fair market value at inheritance).
- Plus major improvements (if known).
- The Estimated Net Gain = Gross Sales Price − Estimated Adjusted Basis − Settlement Expenses.
- The seller must provide this calculation on the Transferor’s Certification to use the alternative method.
Real Estate in a Shutdown: What You Need to Know
There have been some notable changes in the real estate market between week one and week two of the October 2025 U.S. government shutdown. Here’s a summary of the evolving impact:
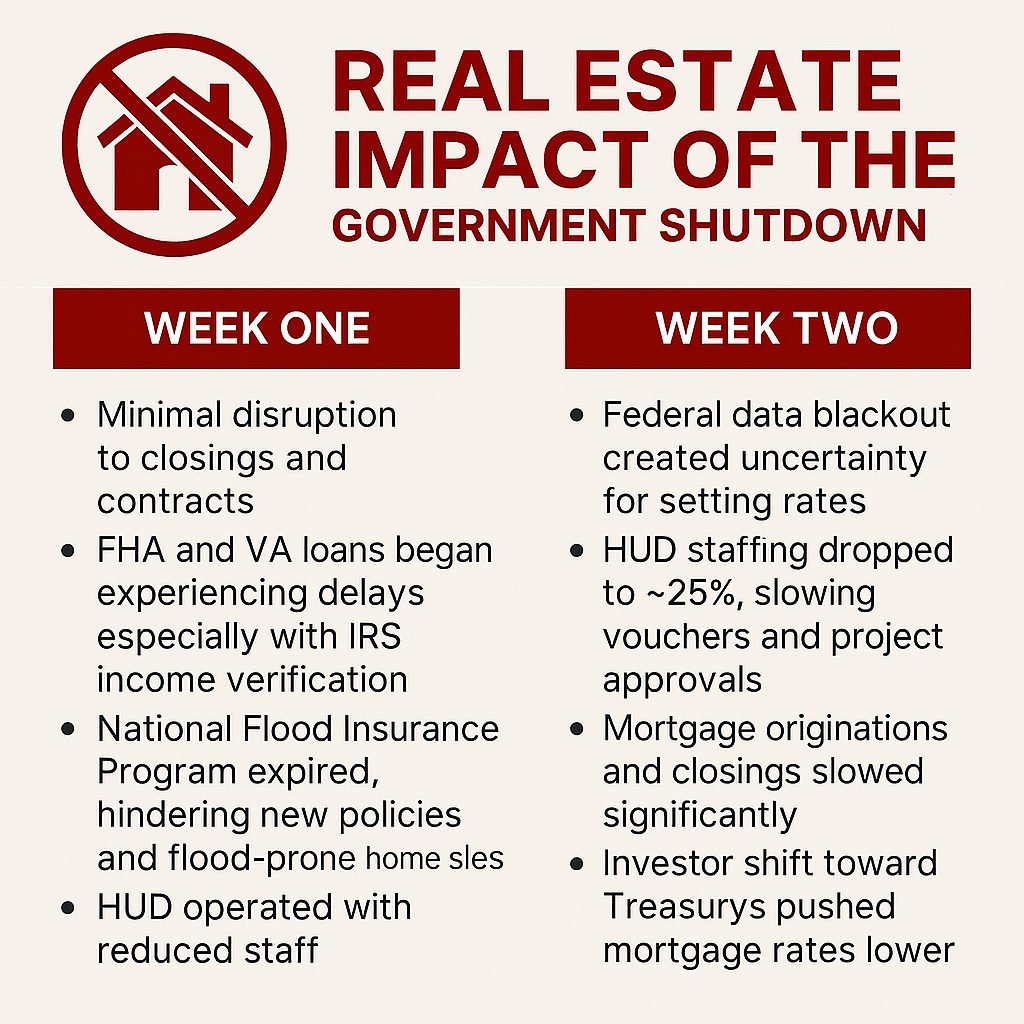
🏠 Week One: Initial Impacts
- Minimal disruption to closings and contracts.
- FHA and VA loans began experiencing delays, especially where IRS income verification was needed.
- National Flood Insurance Program expired on Sept. 30, halting new policies and risking closings in flood-prone areas like Florida.
- USDA loans were largely paused.
- HUD operated with reduced staff, but existing obligations were still being fulfilled.
- Mortgage rates remained stable, with a slight decline due to increased demand for Treasury bonds.
🏠 Week Two: Escalating Effects
- Federal data blackout (no jobs report, inflation data) created uncertainty for the Federal Reserve, which relies on this data to set interest rates.
- HUD staffing dropped to ~25%, delaying housing vouchers and insurance applications for healthcare projects.
- Mortgage originations tied to federal programs slowed significantly — up to 2,500 per day delayed.
- Closings disrupted nationwide, with estimates of 1,300–1,400 per day affected.
- Renters and federal workers began facing financial strain, especially in cities like D.C., Baltimore, and San Antonio.
- Investor behavior shifted toward Treasurys, potentially pushing mortgage rates lower.
- Real estate transactions increasingly reliant on all-cash offers due to financing uncertainty.
📉 Market Sentiment
- Growing economic uncertainty is making buyers more cautious.
- Realtors and lenders are adapting with workarounds, but delays and volatility are increasing.
- Valuations may compress, and private lending is gaining traction as a more reliable alternative.
🧭 Navigating Real Estate During the Shutdown
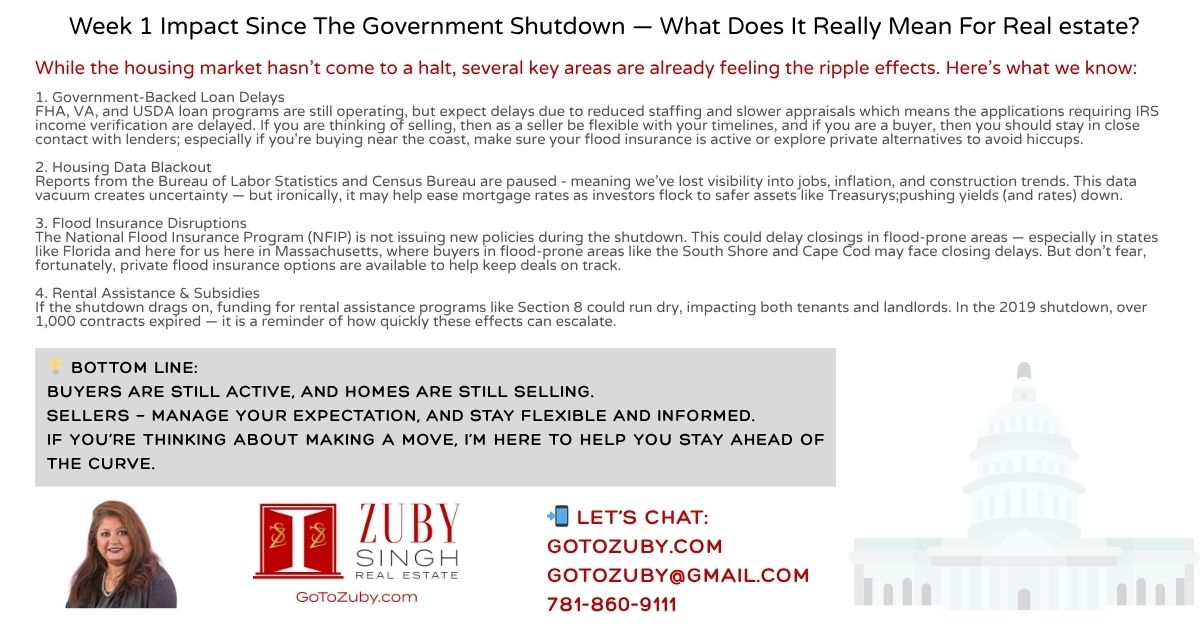
Closings delayed, loans paused, buyers cautious. Our flyer breaks down the impact week by week so you can stay informed and proactive. From delayed closings to financing uncertainty, the October 2025 government shutdown is reshaping the housing market week by week. Download the flyer to stay informed. Questions? Comments?
Let’s strategize together!
Week 1 and 2 Combined
shutdown_real_estate_impact_flyer-2weeks
Week 1
Back To The Basics: Buyer’s Home Inspection Checklist – New MASSACHUSETTS HOME INSPECTION LAW EFFECTIVE 10/15/25
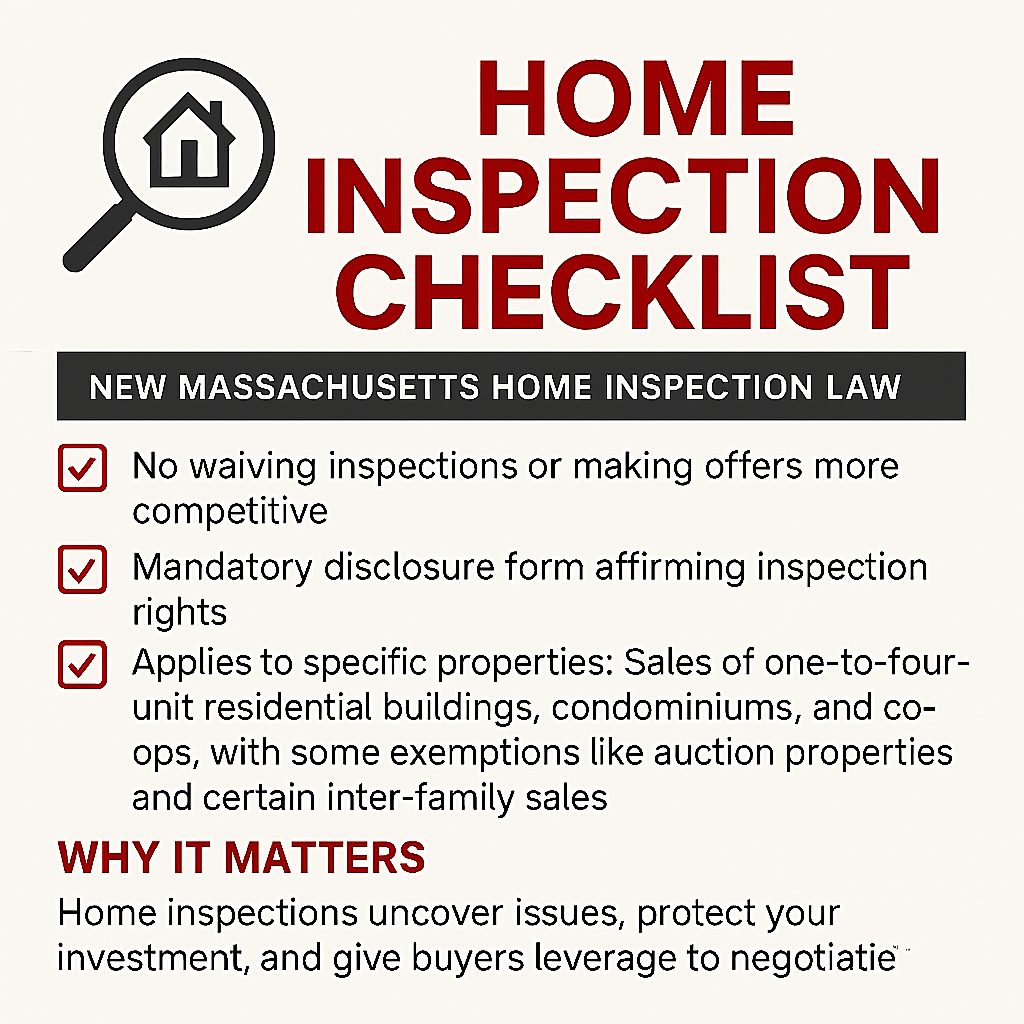
🏡 Buyer’s Home Inspection Checklist – MA Law Update
Law Name: Bill S.2474 – An Act Protecting Consumer Rights in Purchasing Safe and Habitable Homes Part of: The Affordable Homes Act
What does the new law say? In summary
🔒 Sellers and agents can no longer require or suggest waiving inspections to make offers more competitive.
⏳ Buyers get 10 days to inspect and 5 more to review and decide — giving everyone time to make informed decisions.
💡 Why It Matters?
Home inspections uncover hidden issues, protect your investment, and give buyers leverage to negotiate repairs or price adjustments. This new law levels the playing field, especially for first-time buyers.
✅ Know Your Rights
- You cannot be pressured to waive a home inspection.
- A mandatory disclosure form must be signed by both buyer and seller.
🗓️ Inspection Timeline
- 10 days to conduct a home inspection.
- 5 additional days to review findings and make decisions.
🔍 During the Inspection
- Hire a licensed home inspector.
- Focus on safety, structure, and systems (roof, foundation, HVAC, plumbing, electrical).
- Ask questions and take notes/photos.
📊 After the Inspection
- Review the report thoroughly.
- Discuss findings with your agent.
- Consider negotiating repairs or price adjustments.
🤝 Negotiation Tips
- Use inspection results to support your requests. Know Your Leverage – Inspection findings can justify repair requests or price reductions.
- Prioritize major issues over cosmetic ones. Be Reasonable – Focus on safety and structural issues, not cosmetic fixes.
- Lean on your agent for guidance. Work With a Pro – A skilled agent helps you navigate the new rules and advocate for your best interests.
- Stay Professional – Keep emotions out of it. A calm, informed approach wins deals.
📲 Ready to Buy or Sell with Confidence? Let’s talk strategy and navigate this new (old) landscape together.
Real Estate Leads The Way!
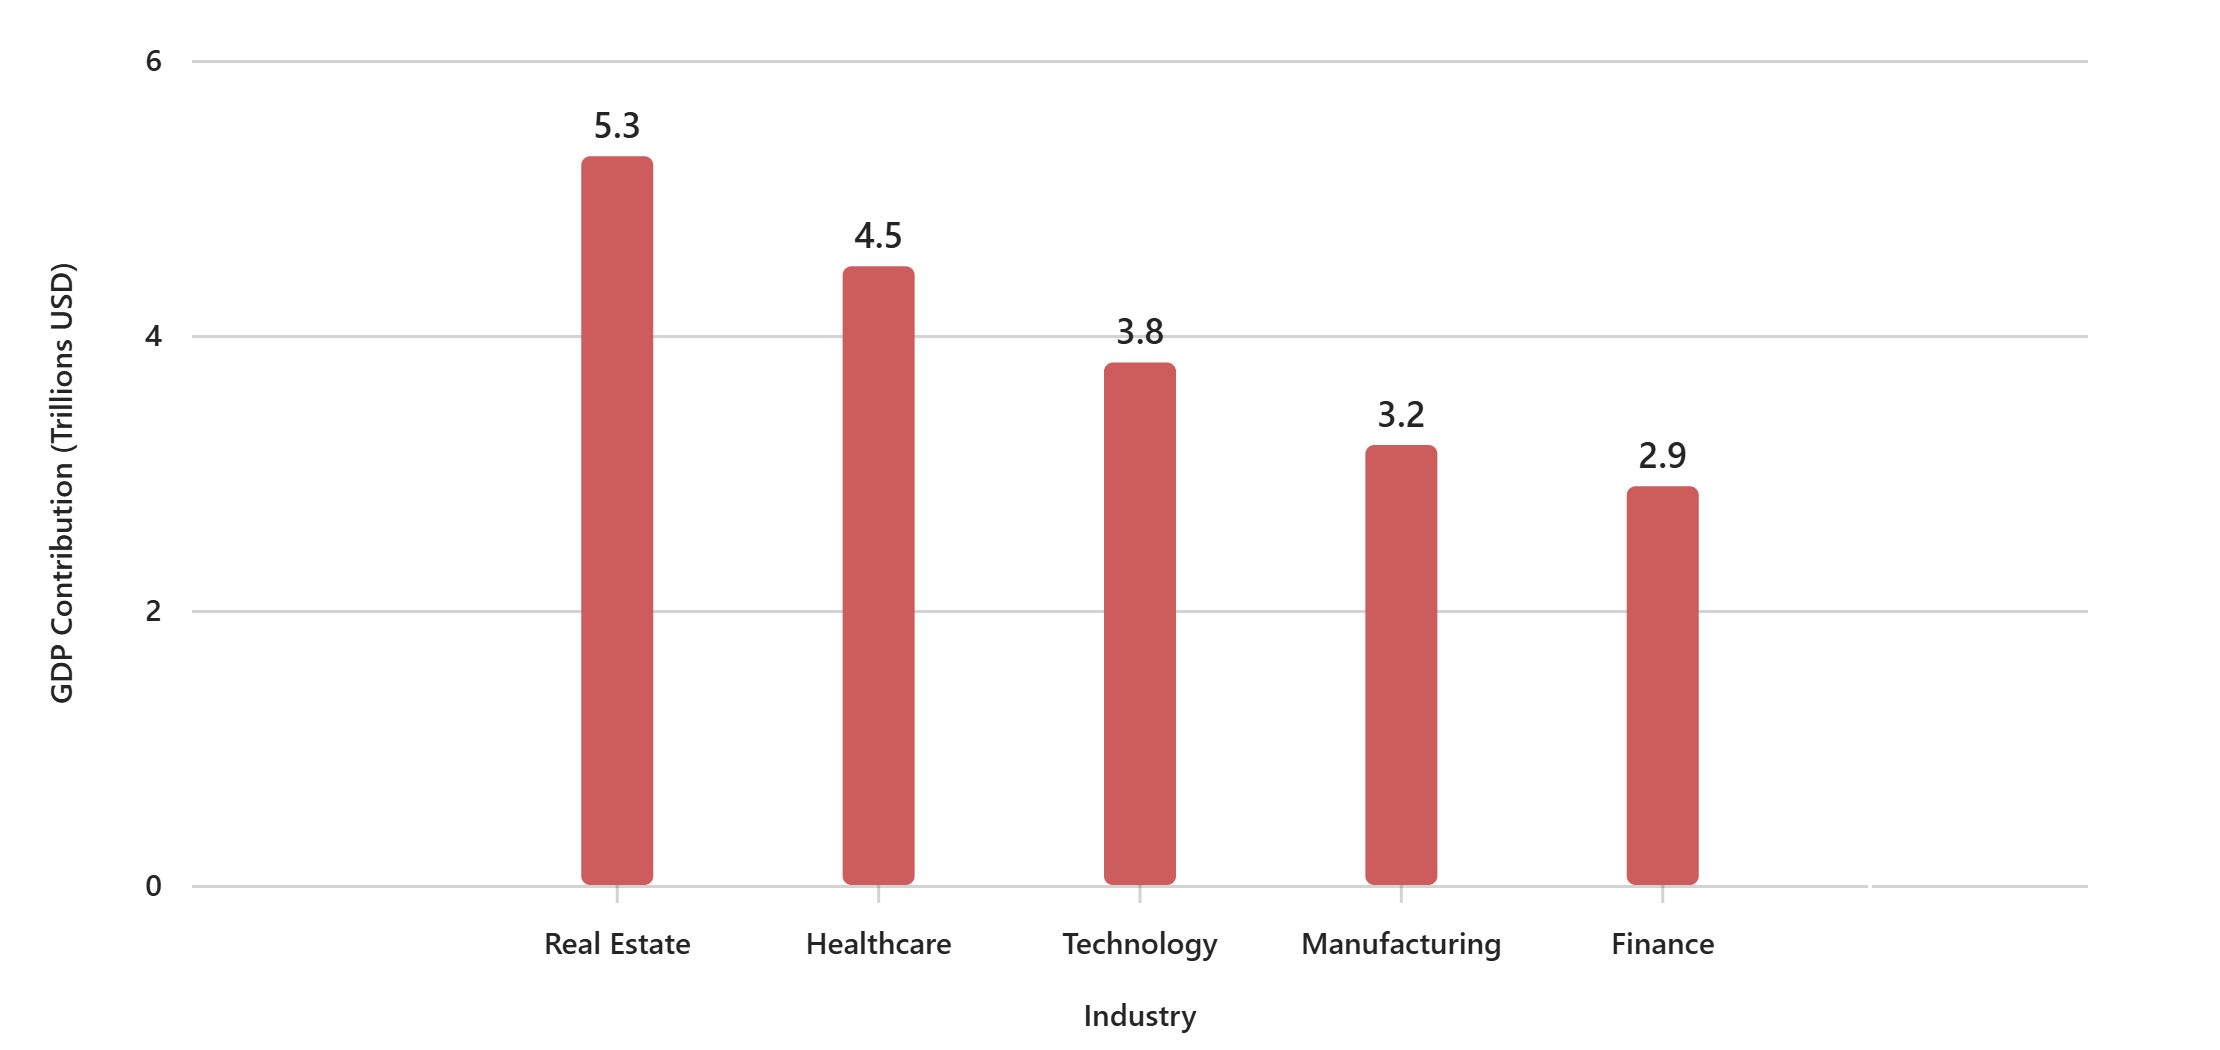
💬 Real estate isn’t just about homes—it’s a powerhouse of the U.S. economy. In 2024, real estate industry contributed a massive and staggering $5.3 trillion to the U.S. GDP, outpacing industries like healthcare, tech, and manufacturing.That’s not just a number—it’s a reflection of how deeply real estate drives our economy.
🏡 From residential sales to commercial development, real estate touches every part of our lives. As a Realtor, I see firsthand how these numbers translate into dreams realized, communities built, and wealth created.📊 Check out this quick comparison—real estate leads the way!
💼 Whether you’re buying, selling, or investing, you’re part of this powerful movement. Let’s talk about how you can make smart moves in today’s market.
#RealEstate #GDP #MarketInsights #RealtorLife #GotoZuby #EconomicImpact #RealEstateTrends #GotoZuby #MarketTrends #Homeownership #LexingtonMA
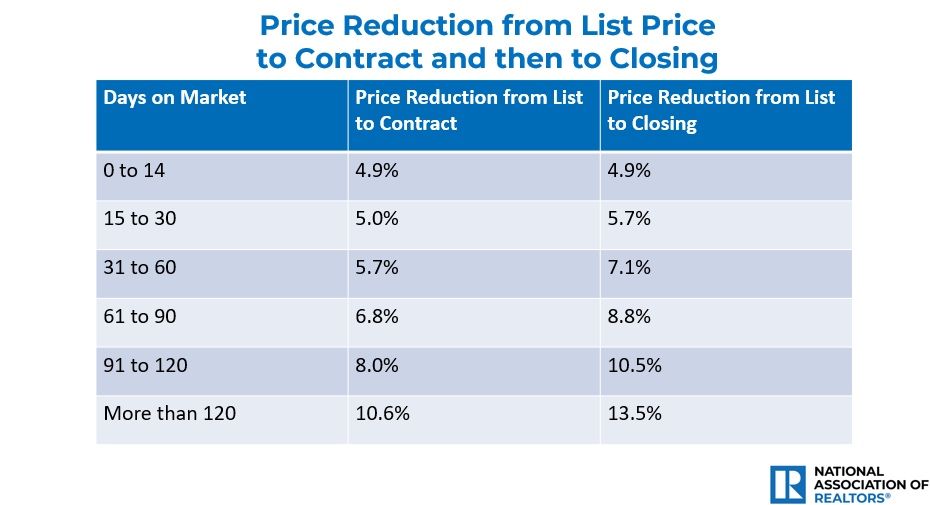
Overpricing Your Home? Here’s What It Could Cost You…
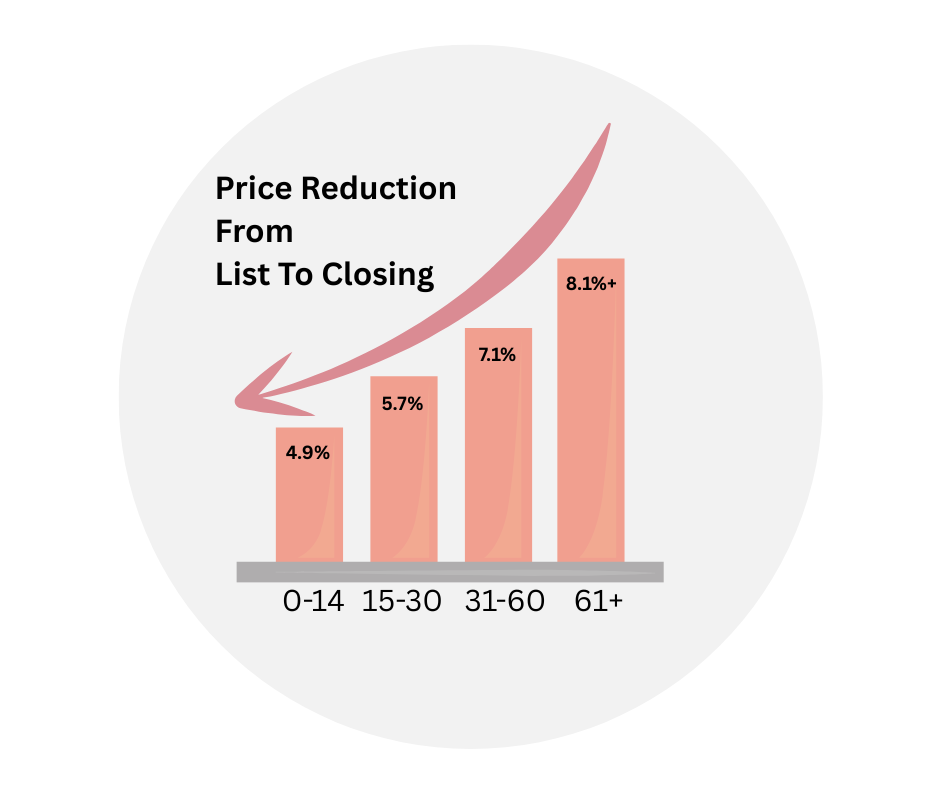
The Hidden Cost of Overpricing Your Home!
Setting the right price from day one is critical. Pricing a home incorrectly from the start can lead to costly consequences. Homes that linger on the market often face deeper price cuts—and even after a buyer signs a contract, the final sale price can still drop due to inspections and appraisals. The longer a property sits on the market, the steeper the price cuts tend to be. According to The National Association Research (NAR), on average, homes see an additional 2% price reduction between contract signing and closing.
📉 On average, sellers see an additional 2% price reduction from contract to closing.
If you are a Seller: Don’t leave money on the table!
Work with me or any knowledgeable agent who understands your local market and can help you price your home right from the start. Let’s talk about how to position and price your property for a successful sale and avoid costly consequences. Some tips to help get you started.
Here is how I or your agent can help by taking proactive steps to help keep the home moving and avoid losses:
- Staging and presentation upgrades to boost buyer interest
- Enhanced marketing efforts including virtual tours and social media
- Pre-listing inspections to avoid surprises later
- Flexible negotiation tactics to close deals faster
- Strategic price adjustments based on market feedback to avoid your property staying further on the market
Q2, 2025 MA Single Family Market Watch Report

Massachusetts Single Family Homes, Q2, 2005 Market Watch Report By MLSPIN
By County and Zip Code
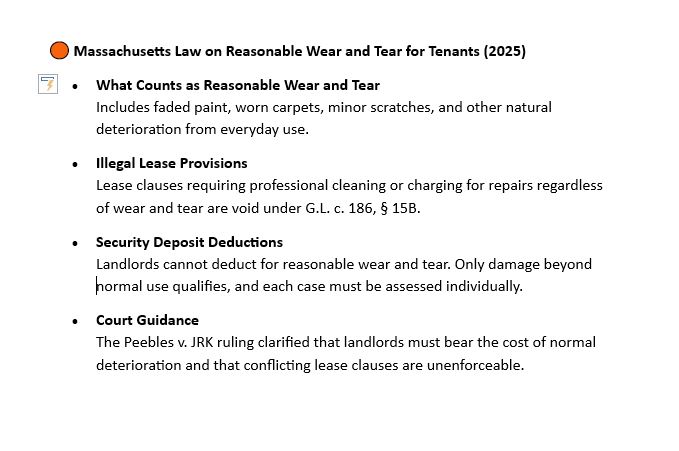
Massachusetts Law Prohibits Landlords From Penalizing Tenants For Reasonable Wear And Tear
🏠 Tenant Rights: What Landlords Can’t Charge For
In Massachusetts, landlords cannot deduct from a tenant’s security deposit for reasonable wear and tear. This is protected under Massachusetts General Laws Chapter 186, Section 15B.
✅ What Is Considered “Reasonable Wear and Tear”?
These are normal signs of everyday living:
- 🎨 Faded paint
- 🧼 Minor carpet wear
- 🖼️ Small nail holes from hanging pictures
- 🚪 Light scuff marks on walls or floors
These cannot legally be charged to tenants.
🛑 What Landlords Cannot Do
- ❌ Require tenants to pay for professional cleaning or repainting due to normal use
- ❌ Include lease clauses that override these protections — such clauses are unenforceable and void
⚖️ Legal Precedent: Peebles v. JRK Property Holdings, Inc. (2025)
The Massachusetts Supreme Judicial Court ruled:
Deductions for cleaning, painting, or refurbishing due to normal use violate tenant protection laws.
💡 What Landlords Can Deduct
- 💸 Unpaid rent
- 🔧 Damage beyond normal wear (e.g., broken fixtures, holes in walls)
- 📄 Repairs with itemized receipts
See indepth law details here: Massachusetts General Laws Chapter 186, Section 15B
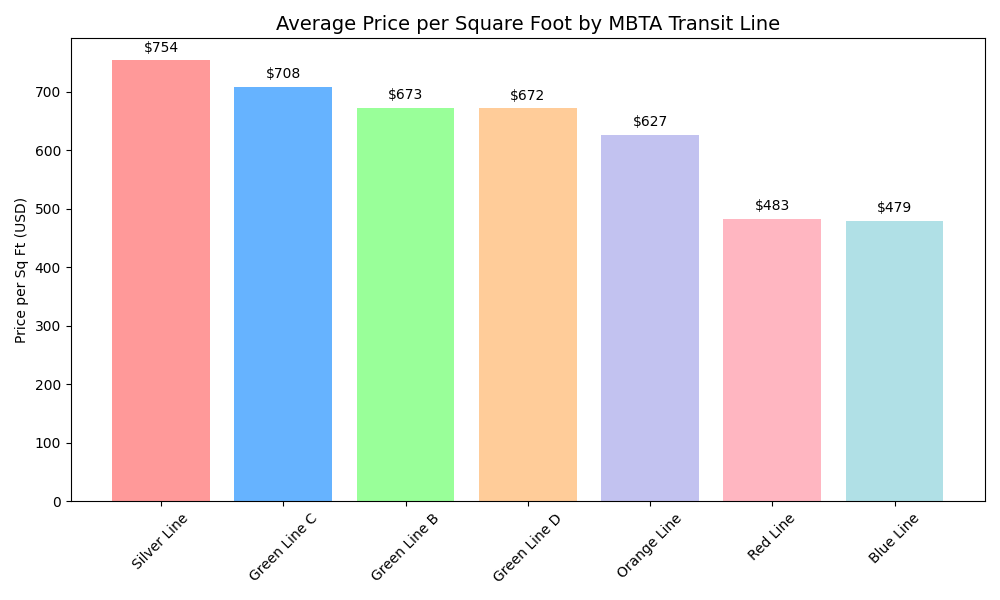
MBTA Transit Line Price Per Square Foot
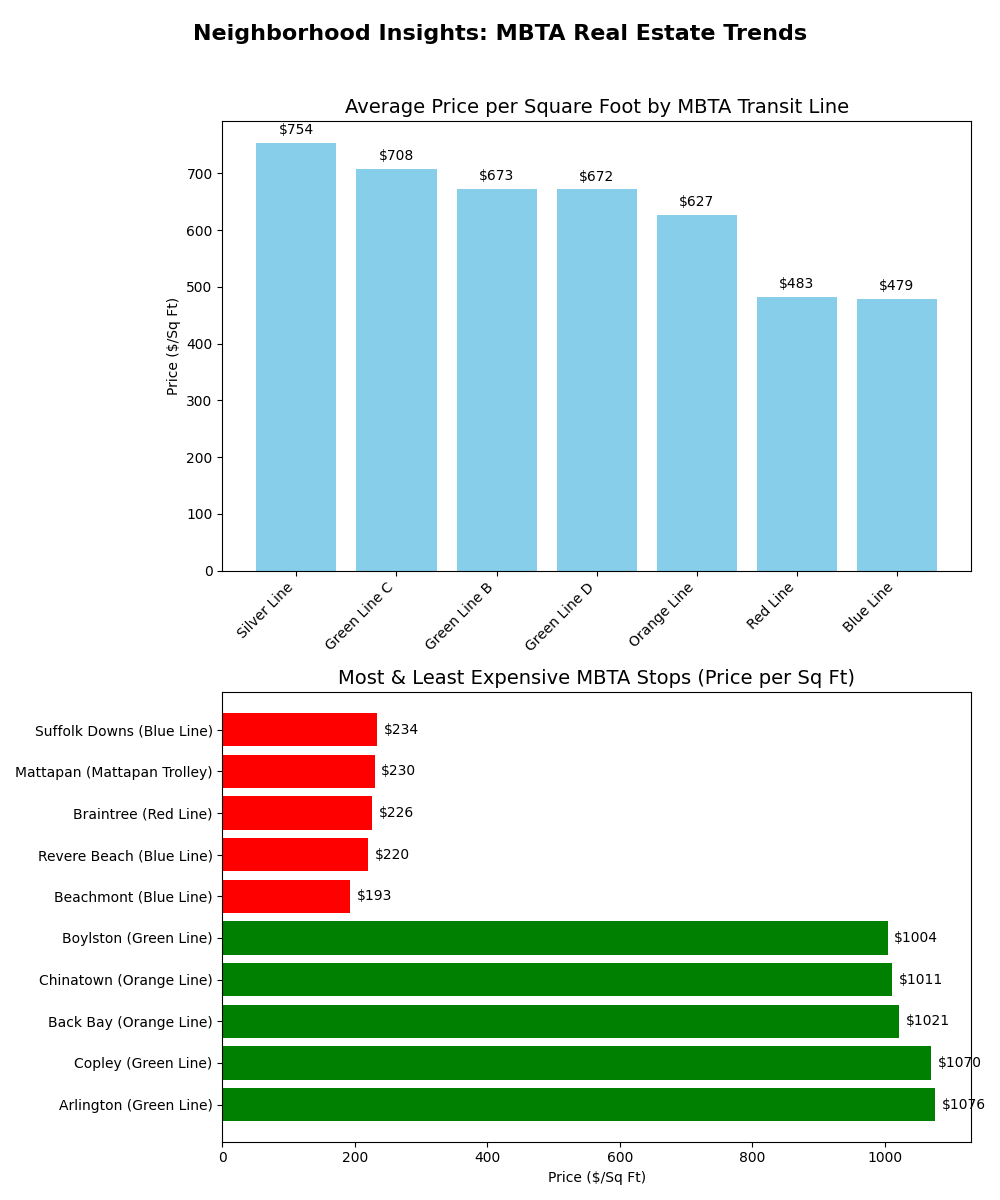
I asked AI, “What is the breakdown of price per square foot by MBTA transit line?”
Here’s what AI had to say about a breakdown of the average price per square foot by MBTA transit line in the Boston area, based on Estately’s analysis of home sales within a half-mile of each stop:
🏙️ MBTA Transit Line Price Per Square Foot
| Transit Line | Average Price/Sq Ft |
|---|---|
| Silver Line | $754 |
| Green Line C Branch | $708 |
| Green Line B Branch | $673 |
| Green Line D Branch | $672 |
| Orange Line | $627 |
| Red Line | $483 |
| Blue Line | $479 |
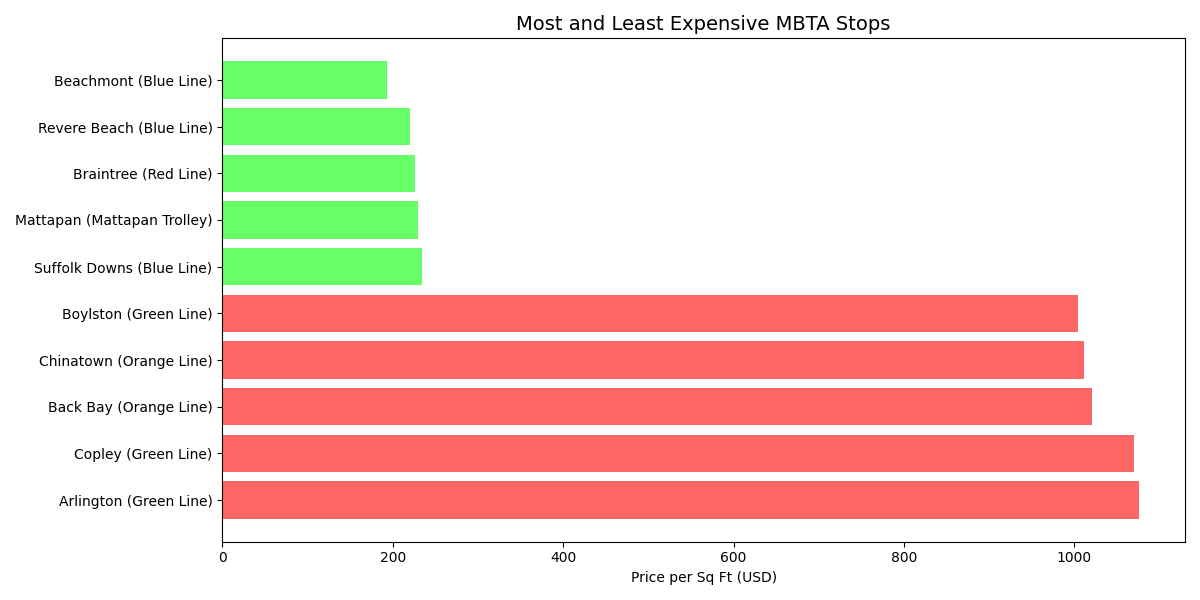
🚉 Most Expensive Stops (Price/Sq Ft)
- Arlington (Green Line) – $1,076
- Copley (Green Line) – $1,070
- Back Bay (Orange Line) – $1,021
- Chinatown (Orange Line) – $1,011
- Boylston (Green Line) – $1,004
🏘️ Least Expensive Stops (Price/Sq Ft)
- Beachmont (Blue Line) – $193
- Revere Beach (Blue Line) – $220
- Braintree (Red Line) – $226
- Mattapan (Mattapan Trolley) – $230
- Suffolk Downs (Blue Line) – $234
Please see the breakdown by stop and and T color line/branch
https://www.estately.com/boston-area-home-affordability-transit-stop

As can be seen per estately.com analysis,
Boston median price per square foot by transit line
Silver Line: Holds the highest average price per square foot at $754.
Green Line: Varies by branch, but generally high:
“C” Branch: $708
“B” Branch: $673
“D” Branch: $672
Orange Line: $627
Red Line: $483
Blue Line: $479
Most expensive/affordable areas near transit
Most expensive: Arlington Stop on the Green Line boasts the highest price per square foot at $1,076. Other expensive areas include Back Bay ($1.5K/sq ft) and Beacon Hill ($1.4K/sq ft) which are served by multiple lines.
Least expensive: Beachmont stop on the Blue Line was identified as the least expensive at $193 per square foot.
Commuter rail zones
The Commuter Rail system is divided into 11 fare zones (Zone 1A to Zone 10), with Zone 1A representing stations closest to downtown Boston. Commuter rail zones generally indicate distance from downtown. Specific median home prices per square foot by commuter rail zone were not identified in the search results but a strong correlation between proximity to the city center (lower zone numbers) and higher property values can be inferred.
Note: The above provided data comes from various sources and may reflect different timeframes. Some data, such as the analysis by Estately, is based on data from the last six months (as of when the analysis was published).
Case Study: Housing Affordability in Lexington, MA (2025)
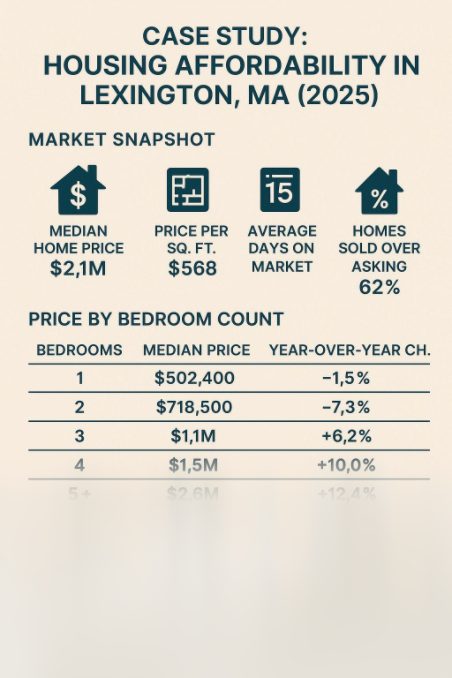
🏡 Case Study: Housing Affordability in Lexington, MA (2025)
Lexington, Massachusetts continues to be one of the most competitive housing markets in the state. In June 2025, the median home sale price reached $2.1 million, marking a 29.2% increase year-over-year. This sharp rise reflects strong demand and limited inventory, making it a seller’s market.
📊 Key Stats:
- Median Price per SqFt: $568
- Average Days on Market: 15 days
- Sale-to-List Price Ratio: 104.4% (homes selling above asking)
- Homes Sold Over Asking: 62%
2. https://www.redfin.com/city/36128/MA/Lexington/housing-market
🛏️ Price by Bedroom Count (June 2025):
| Bedrooms | Median Price | YoY Change |
|---|---|---|
| 1 BR | $502,400 | -1.5% |
| 2 BR | $718,500 | -7.3% |
| 3 BR | $1.1M | +6.2% |
| 4 BR | $1.5M | +10.0% |
| 5+ BR | $2.6M | +12.4% |
🏘️ Inventory Trends:
- Total homes for sale: 139 (down 3.5% from May)
- Most homes sell within 30 days
- Inventory for 2-bedroom homes increased by 50%, while 1-bedroom homes dropped by 33%
2. https://www.redfin.com/city/36128/MA/Lexington/housing-market
💡 What This Means for Buyers
With prices rising and homes selling quickly, affordability is a growing concern. Buyers need to act fast, often competing with multiple offers and paying above asking. Lexington’s rising prices and fast-moving inventory make it a challenging market for first-time buyers and families with moderate incomes. With homes selling above asking and limited affordable options, many buyers are looking to nearby towns or considering reverse migration—moving to less expensive areas with more space and flexibility. For first-time buyers or those with moderate incomes, Lexington may be out of reach without significant financial planning or assistance.
For more on Housing Affordability Index check out my other blog explaining it. Let’s connect…
Housing Affordability Index
What does Housing Affordability Mean?
It refers to the relationship between household income and housing costs—essentially, whether people can reasonably afford to buy or rent a home without compromising their ability to pay for other essentials like food, healthcare, and transportation. Factors Affecting Affordability: Local wages and employment opportunities, Home prices and rental rates, Availability of housing stock (especially affordable units), Interest rates (for buyers), and Government policies and subsidies.
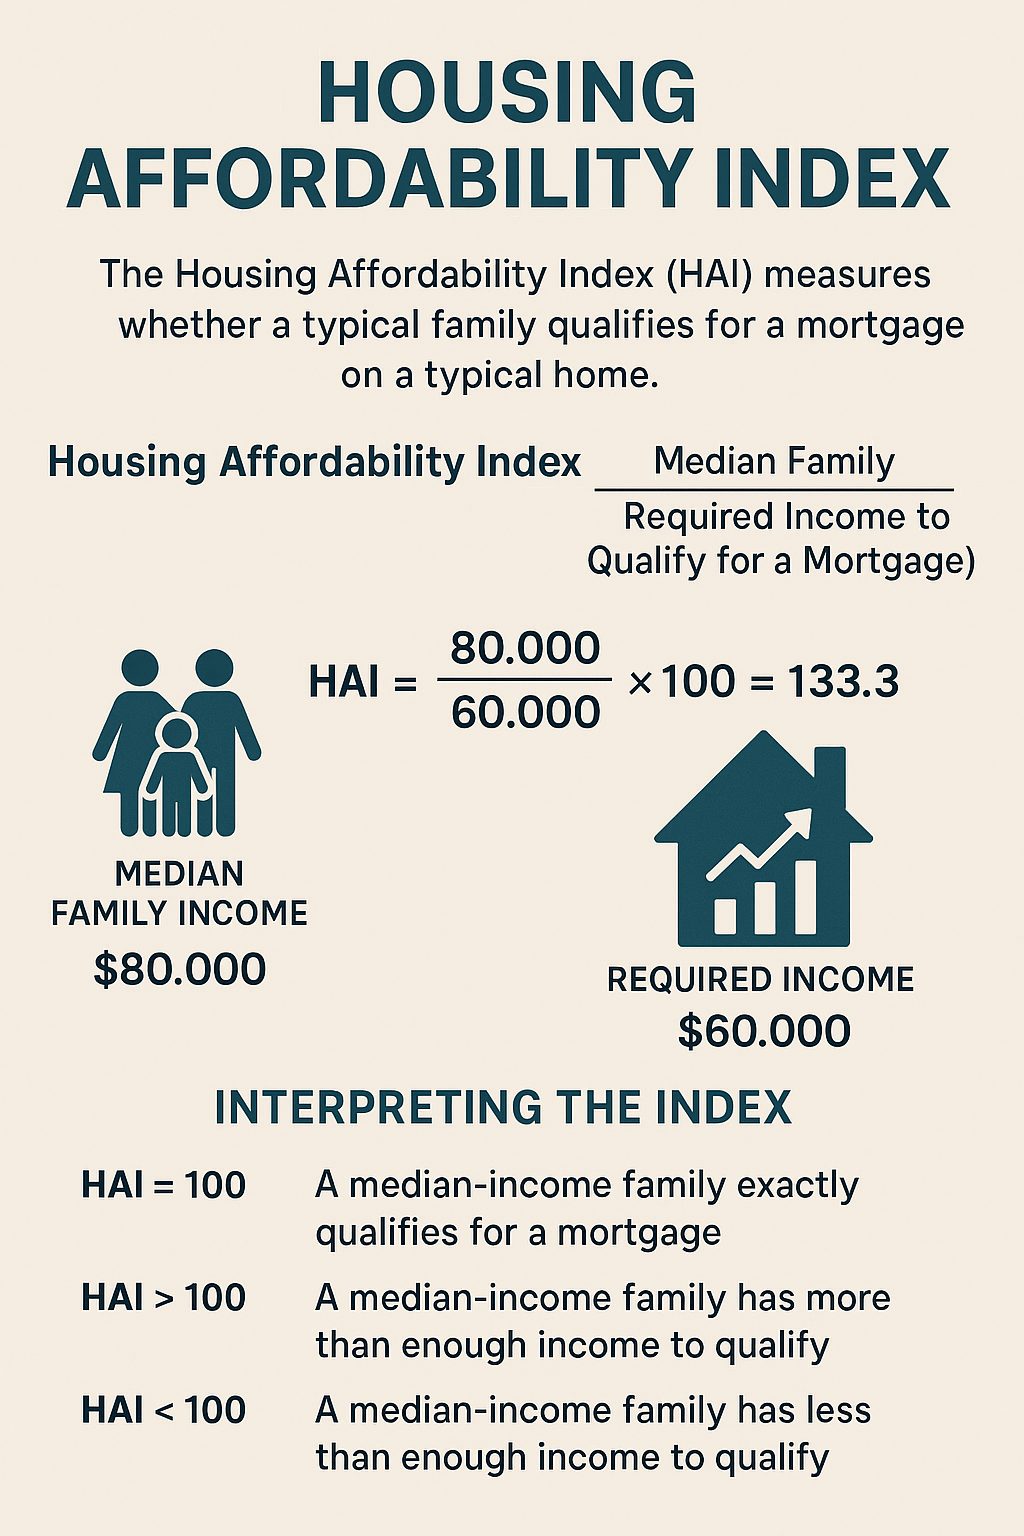
There is an Housing Affordability Index (HAI) that is put out by the National Association of Realtors (NAR) in the U.S. The Housing Affordability Index (HAI) is a measure used to determine whether a typical family earns enough income to qualify for a mortgage on a typical home. It’s a key tool in understanding how affordable housing is in a given area or time period. Based on a 30-year fixed mortgage with a 20% down payment and uses Freddie Mac’s mortgage rate data, assumes a 25% qualifying ratio, meaning housing expenses should not exceed 25% of gross monthly income.Their formula is:
Housing Affordability Index = (Median Family Income / Required Income to Qualify for a Mortgage) × 100
Median Family Income: The average income of a typical household.
Required Income: The income needed to qualify for a mortgage on a median-priced home, assuming:
20% down payment
30-year fixed mortgage
Standard qualifying ratio (usually 25% of income goes to housing costs)
📊 Interpreting the Index
- HAI = 100: A family earning the median income has exactly enough to qualify for a mortgage.
- HAI > 100: Housing is more affordable—the family earns more than needed.
- HAI < 100: Housing is less affordable—the family earns less than needed.
🏠 Example
If the median income is $80,000 and the income needed to afford a median-priced home is $60,000:
This means the typical family earns 33% more than needed to afford a home.
Why Does It Matter?
Lack of affordable housing can lead to overcrowding, homelessness, and economic instability. It affects where people can live, work, and raise families—impacting everything from education access to job opportunities. NAR puts out a Metro Market Statistics Dashboard showing the stats for each of these factors. There are currently many challenges and the implications of the current housing affordability crisis for buyers in 2025 are significant and multifaceted.
Here’s a breakdown of the key challenges and trends:
🏠 1. Rising Home Prices and Mortgage Costs
- Home prices have surged nearly 60% since 2019, with the median existing single-family home now costing $412,000, which is five times the median household income
1. https://www.realtor.com/news/trends/affordability-crisis-home-prices-record-household-income-housing-report-2025/
- Monthly mortgage payments have increased dramatically, now averaging $2,570, which is 40% higher than in 1990 (adjusted for inflation)
1. https://www.realtor.com/news/trends/affordability-crisis-home-prices-record-household-income-housing-report-2025/
- Buyers now need to spend 45% more of their income on mortgage payments compared to 2019
2. https://www.jpmorganchase.com/institute/all-topics/community-development/the-affordability-gap-is-home-ownership-still-within-reach-in-todays-economy
📉 2. Declining Affordability Index
- The U.S. Housing Affordability Index dropped from 150 in 2021 to the mid-80s by 2024, indicating a sharp decline in affordability
3. https://resimpli.com/blog/housing-affordability-statistics/
- Only 60% of U.S. counties are affordable for households earning the local median income, down from 90% five years ago
3. https://resimpli.com/blog/housing-affordability-statistics/
🧓 3. Changing Buyer Demographics
- The average age of first-time homebuyers rose to 38 years old, as younger buyers struggle to afford homes
2. https://www.jpmorganchase.com/institute/all-topics/community-development/the-affordability-gap-is-home-ownership-still-within-reach-in-todays-economy
- Millennials make up 70% of first-time buyers, but many are priced out due to stagnant wages and rising costs
3. https://resimpli.com/blog/housing-affordability-statistics/
🏘️ 4. Shifts in Buyer Preferences
- Suburban housing is preferred by 56% of buyers, likely due to lower prices compared to urban centers
3. https://resimpli.com/blog/housing-affordability-statistics/
- Modular and small homes are gaining popularity, with 67% of respondents believing they will become mainstream
3. https://resimpli.com/blog/housing-affordability-statistics/
💸 5. Financial Strain and Cost Burden
- 31.8% of households are cost-burdened, spending more than 30% of their income on housing
3. https://resimpli.com/blog/housing-affordability-statistics/
- In cities like Boston, property taxes and insurance add up to $1,000/month on top of mortgage payments
1. https://www.realtor.com/news/trends/affordability-crisis-home-prices-record-household-income-housing-report-2025/
🔒 6. Lock-In Effect and Inventory Shortage
- Many homeowners are reluctant to sell due to low existing mortgage rates, reducing inventory and pushing prices higher
1. https://www.realtor.com/news/trends/affordability-crisis-home-prices-record-household-income-housing-report-2025/
- Housing inventory has decreased by 30% since 2019, further limiting options for buyers
3. https://resimpli.com/blog/housing-affordability-statistics/
🧠 Implications for Buyers
- Affordability planning is critical: Buyers must reassess budgets and consider longer mortgage terms or alternative housing types.
- Expect lifestyle compromises: Many are opting for smaller homes, suburban locations, or extensive renovations to make purchases feasible.
- Financial literacy and preparation: With rising down payments and closing costs, buyers need stronger financial strategies and savings.
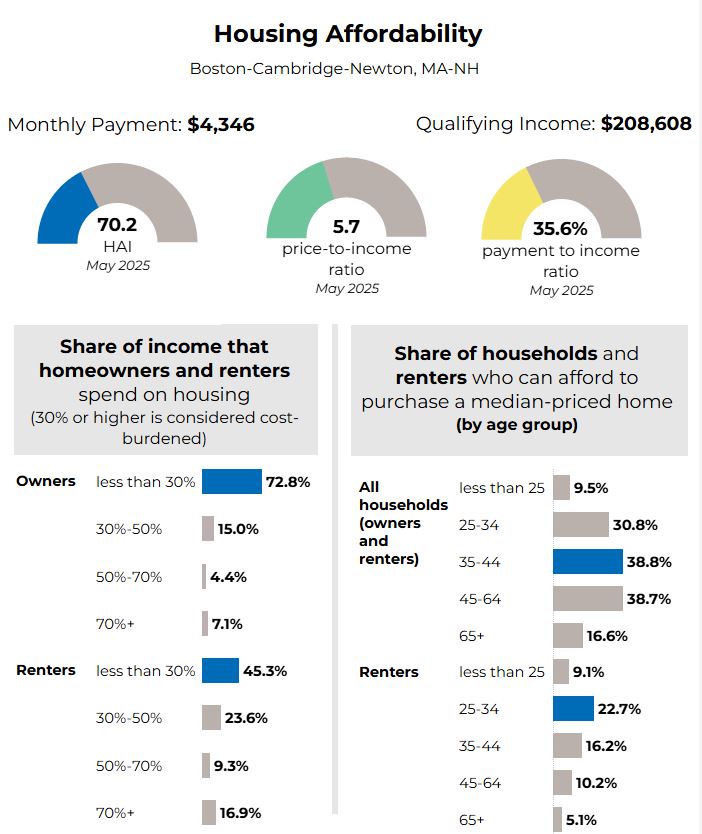
A local Example of the House Affodability
A report put out by NAR shows the most recent housing, demographic, economic and affordability statistics for Boston-Cambridge-Newton, MA-NH area.
- https://www.nar.realtor/research-and-statistics/housing-statistics/metro-market-statistics
Here are some staggering statistics for the share of income that homeowners and renters spend on housing. 30% or higher is considered cost-burdened.
🏠 Key Affordability Metrics
- Monthly Mortgage Payment: $4,346
- Qualifying Income: $208,608
- Housing Affordability Index (HAI): 70.2
- A lower HAI indicates reduced affordability. A value of 100 means a median-income household can afford a median-priced home. At 70.2, affordability is significantly below the national benchmark.
- Price-to-Income Ratio: 5.7
- This is quite high. A healthy ratio is typically around 3–4.
- Payment-to-Income Ratio: 35.6%
- This exceeds the recommended threshold of 30%, suggesting that housing costs are burdensome for many buyers.
📊 Housing Cost Burden by Tenure
Homeowners
- 72.8% spend less than 30% of income on housing (considered affordable).
- 27.2% are cost-burdened:
- 15.0% spend 30–50%
- 4.4% spend 50–70%
- 7.1% spend more than 70%
Renters
- Only 45.3% spend less than 30% of income on rent.
- A significant 54.7% are cost-burdened:
- 23.6% spend 30–50%
- 14.6% spend 50–70%
- 16.9% spend more than 70%
🔍 Renters are more severely impacted by affordability challenges than homeowners.
👥 Affordability by Age Group
All Households (Owners + Renters)
- 35–44 and 45–64 age groups have the highest affordability (≈38.8%)
- Under 25: Only 9.5% can afford a median-priced home
- 65+: Just 16.6% can afford
Renters Only
- Under 25: 9.1% can afford
- 25–34: 22.7%
- 35–44: 16.2%
- 45–64: 10.2%
- 65+: 1.5%
🔍 Older renters (especially 65+) face the greatest affordability challenges, likely due to fixed incomes and lack of home equity.
🧭 Overall Takeaways
- Affordability is a key and most urgent challenge in today’s housing market.
- Given the high house prices and tight inventory, many nuyers are holding on in this market and their dreams of owning a home the traditional way is just that, a dream still.
- Boston MA-NH is one of the least affordable metro areas in the U.S.
- High housing costs are disproportionately affecting renters, young adults, and seniors.
- The HAI of 70.2 and payment-to-income ratio of 35.6% highlight systemic affordability issues.
- Policy implications could include expanding affordable housing, rent control measures, and targeted assistance for vulnerable age groups.


