
 Facebook
 X
X
 Pinterest
 Copy Link
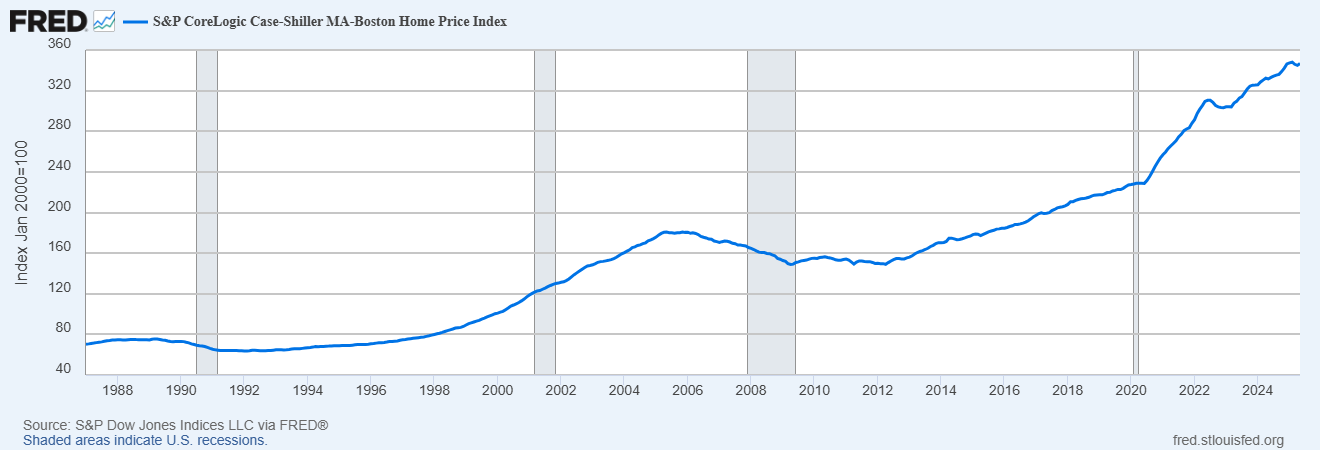
The Case-Shiller Home Price Index is a widely respected measure of U.S. residential real estate prices. It provides insights into home price trends across different metropolitan areas and is often used to gauge (indicator) the health and trends of the housing market. This Index tracks changes in residential real estate values across major US metropolitan areas. It is known for its ability to capture both overall price movements and regional variations. The index has shown significant fluctuations throughout its history, including periods of rapid price appreciation and subsequent declines, particularly during the housing bubble of the mid-2000s.
🏠 Some Key Insights from the Case-Shiller Index are as follows:
Home Price Trends Over Time
It tracks changes in the price of single-family homes over time, showing whether prices are rising or falling in specific regions or nationally.
Market Comparisons
The index includes several regional indices (like for Boston, New York, San Francisco, etc.) and a national index, allowing comparisons between local and national housing markets.
Repeat Sales Methodology
It uses a repeat sales approach, comparing the prices of the same property over time to eliminate distortions from different property types or quality levels.
Economic Indicators
Economists and policymakers use it to assess housing market strength, consumer wealth, and potential inflationary pressures.
Investor Sentiment
Real estate investors and analysts use it to identify market cycles and make informed decisions about buying or selling property.
Quik focus on the Boston housing market using the latest Case-Shiller Home Price Index and July 2025 trends:
🏡 Boston Housing Market Update – July 2025
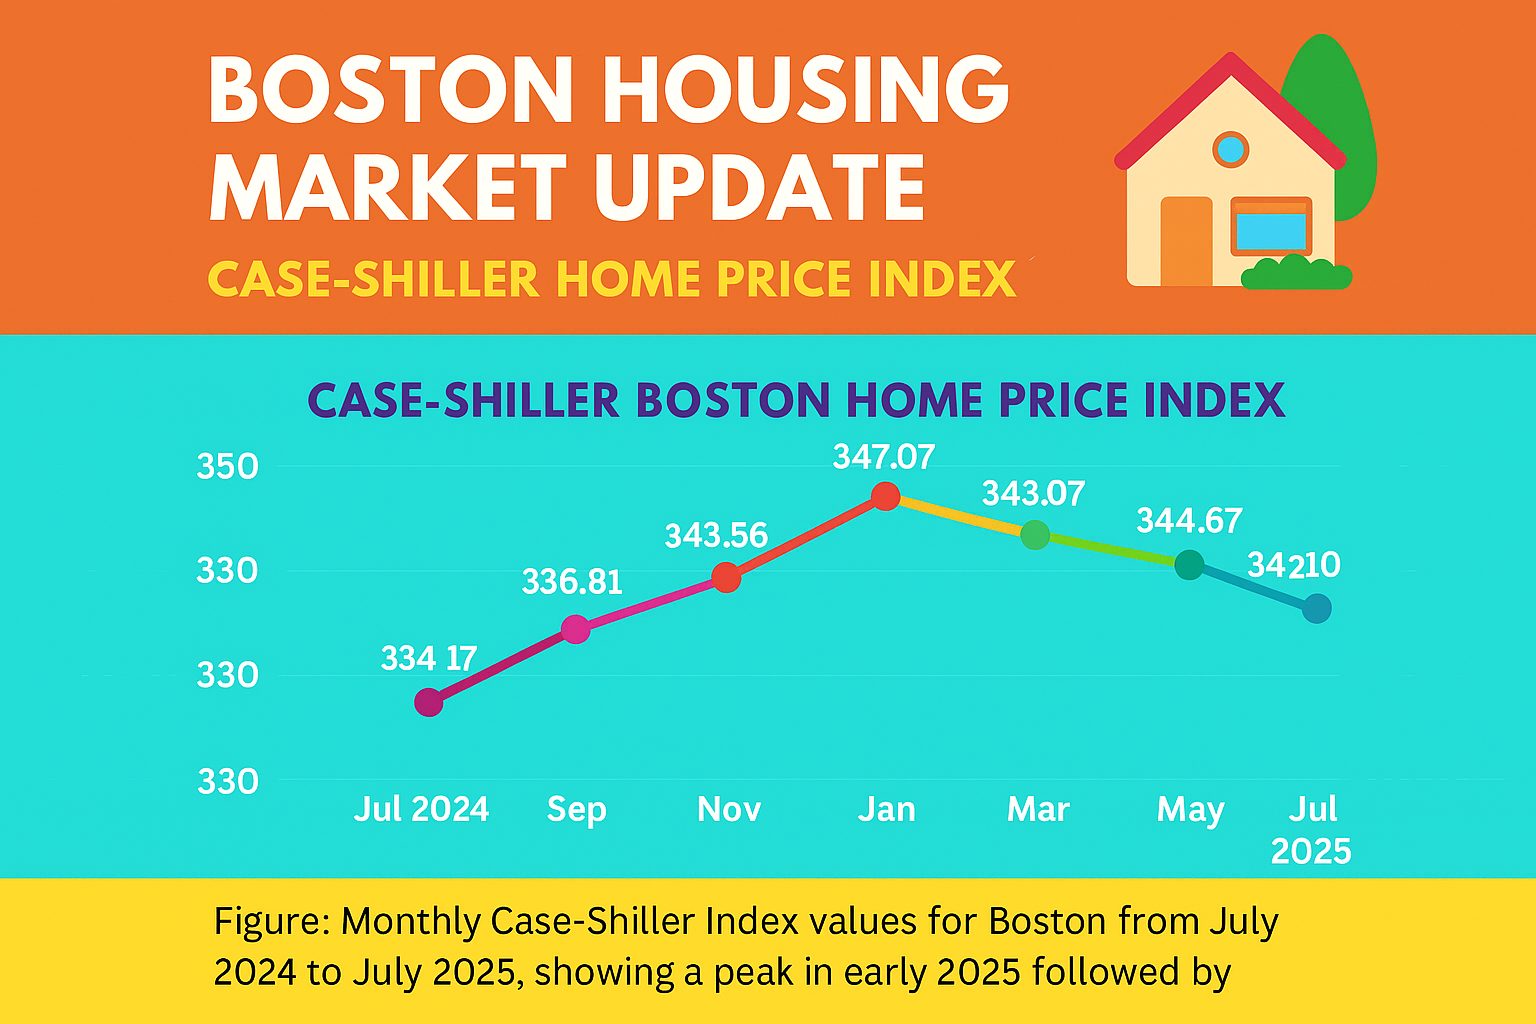
📈 Case-Shiller Index Snapshot
As of April 2025, the S&P CoreLogic Case-Shiller Boston Home Price Index stood at 344.67, marking a modest decline from its peak of 347.94 in February 2025
1.https://fred.stlouisfed.org/series/BOXRSA
This index, which tracks repeat sales of single-family homes, suggests that home price growth in Boston has slowed, reflecting broader national trends.
🔍 What This Means for Boston
Prices are stabilizing after a rapid post-pandemic rise.
The slight dip in the index may signal a more balanced market, offering opportunities for buyers who were previously priced out.
Compared to July 2024 (Index: 334.17), prices are still up year-over-year, but the pace of growth has clearly moderated
2. https://ycharts.com/indicators/case_shiller_home_price_index_boston
🏘️ July 2025 Housing Trends in Boston & Beyond
According to Realtor.com’s July 2025 report, the national housing market is rebalancing, and Boston is part of this shift
3. https://www.realtor.com/research/july-2025-data/
📊 Inventory & Listings
Inventory is up nationwide for the 21st straight month, but Boston’s growth is more modest compared to the South and West.
New listings rose 7.3% year-over-year, though they’ve declined month-over-month since April.
⏳ Time on Market
Homes in Boston are spending more time on the market, with the national median now at 58 days—7 days longer than last year.
This suggests less urgency among buyers, and potentially more room for negotiation.
💰 Pricing Trends
The national median list price is $439,990, up just 0.5% year-over-year.
In the Northeast, prices rose slightly (+0.2%), but Boston’s growth is likely in line with this modest uptick.
Price cuts were reported on 20.6% of listings, indicating sellers are adjusting expectations.
🧠 What Buyers & Sellers Should Know
For Buyers:
More choices and slower price growth make this a good time to explore options.
Be prepared for longer negotiations and less competition than in recent years.
For Sellers:
Pricing strategically is key—overpricing may lead to longer time on market.
Consider staging and incentives to stand out in a more balanced environment.
Comparison of Boston area vs US for the last 30 years.
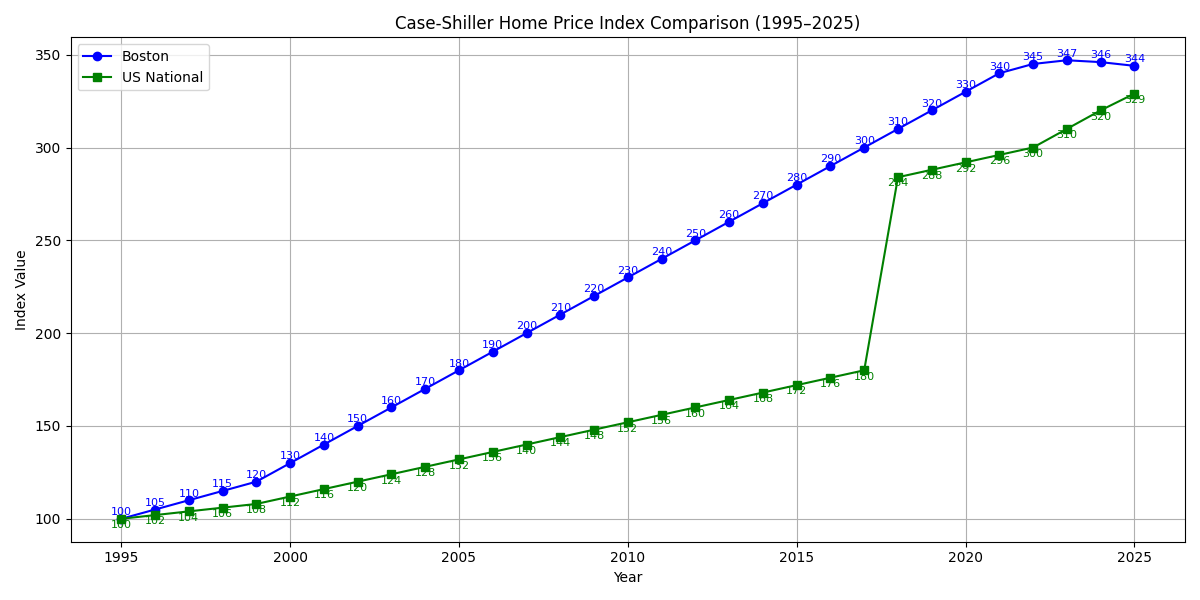
Clearly Boston has outpaced over the past three decades; Boston has proven to be a resilient and appreciating market, outperforming national averages.
Highlights:
Blue line: Boston Index, peaking at 347 in early 2025.
Green line: US National Index, peaking at 329 in early 2025.
A close up for the last year for Boston area
Whether you’re planning to buy, sell, or invest, staying informed with long-term data can help you make smarter decisions. Let’s connect.


