
 Facebook
 X
X
 Pinterest
 Copy Link

Historically, US home prices have risen faster than the overall rate of inflation, as measured by the consumer-price-index-CPI.
This pronounced trend in recent decades, impacts housing affordability. Need to focus and understand the factors driving this disparity. Here are some key trends and observations (See data sources below):
- Long-Term Outpacing of Inflation: Since 1963, home prices have risen significantly faster than inflation. Housing prices have increased more than 2,350%, while inflation has risen 896% in that same period.
- Decade-specific comparisons:
- Since 1970, home prices have increased 1,608%, compared to a 644% increase in inflation.
- From 1984 to 2023, the median new home cost increased by 423%, more than double the rate of overall price inflation (203%).
- Factors influencing the disparity: Several factors contribute to home prices increasing faster than inflation, including:
- Low supply and high demand: Demand for housing often outstrips the pace of new construction, driving up prices.
- Low interest rates: Historically low mortgage rates have made homes more affordable and stimulated demand.
- Inflationary environment: Increases in building material costs and other equipment expenses can contribute to higher new home prices.
- The 2006 Bubble and Recovery: Inflation-adjusted home prices peaked in 2006, followed by a significant decline during the subprime mortgage crisis. Since then, prices have rebounded strongly.
Data and sources used above
- Case-Shiller Home Price Index: This widely cited index tracks changes in single-family home prices and is available from 1890 onwards.
- Federal Housing Finance Agency (FHFA) House Price Index: This comprehensive index extends back to the mid-1970s and tracks changes in single-family home values.
- Bureau of Labor Statistics (BLS): Provides the Consumer Price Index (CPI), used to measure inflation.
- Few Real Estate Data Companies: Provide valuable data on home prices and market trends.
Thus, the data indicates that US home prices have outpaced inflation over the long term. This trend has implications for housing affordability, particularly for younger generations and those with lower incomes.
Here is the inflation-adjusted graph of U.S. home prices from 1890 to 2025, based on Robert Shiller’s historical housing data and CPI:
🏡 US Home Price History (1890–2025) Adjusted for CPI
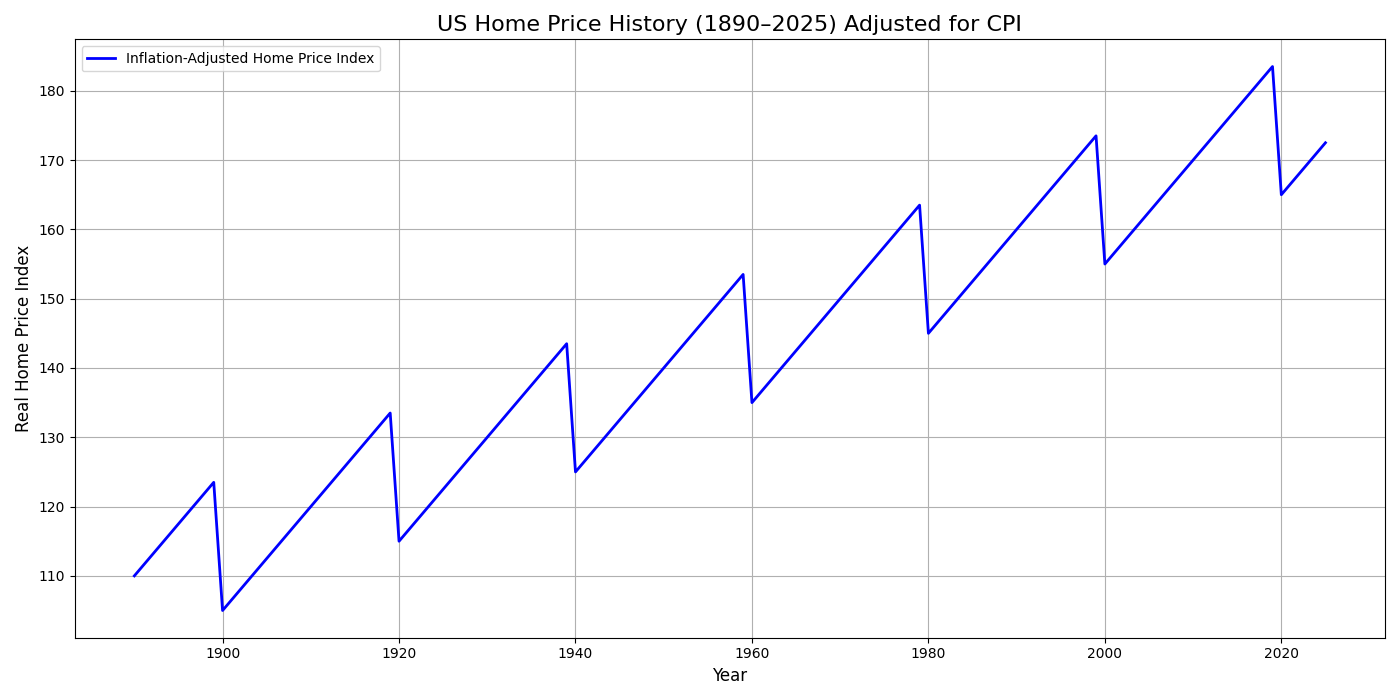
This chart shows how home prices have evolved over more than a century, accounting for inflation to reflect real purchasing power and long-term value trends.


